The Public Lab Blog
stories from the Public Lab community
About the blog | Research | Methods

Issues 1-3 of The Barnraiser
At this year's Barnraising, @patcoyle, @marlokeno, @lombana and I published a daily, one-page newspaper covering each day's events. For our work, and particularly for the final issue (which I was basically not involved in!), we were awarded a "Pullet-zer Prize" by @tonyc (anyone have a picture of this?).
For those of you who didn't get a copy at breakfast, or who weren't able to join us in Cocodrie, Louisiana, here are the first three issues of the Barnraiser, from Friday through Sunday.
Thanks to everyone involved, and please leave your thoughts, feedback, ideas, etc in the comments below!
Issue 1: Friday Nov 19
PDF: barnraiser-2015-11-19.pdf
Issue 2: Saturday Nov 20
PDF: The_Barnraiser--Saturday__Nov_20.pdf
Issue 3: Sunday Nov 21
PDF: The_Barnraiser--Sunday__Nov_21.pdf
Follow related tags:
community louisiana documentation cocodrie
Relevance of Virtual Reality to the World of Grassroots Mapping and Citizen Science?
Why I'm interested
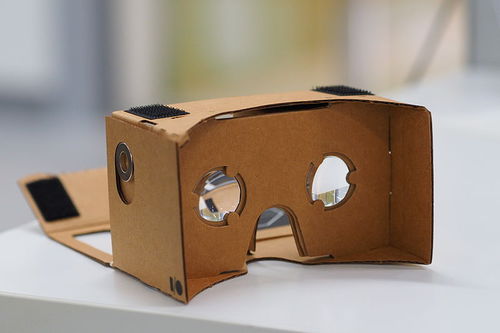
I've been hearing about Virtual Reality since the "Lawnmower Man" days of the 1990s, and up until about a week ago my view of it as an expensive toy for rich people remained consistent. Then I belatedly discovered something introduced over a year ago by Google that, if I didnt know better, I could've easily been convinced came straight out of the PublicLab Store! Google Cardboard is such a simple approach to high-end technology that I actually thought it was an April Fools joke when first introduced (I.e Google Cardboard as competitor to Amazon Cardboard piling up in the recycling bin...). Cardboard VR was initially a simple stereoscope through which 3D imagery was produced by a smartphone. By making VR videos, games and map content available as smartphone apps however, the "Cardboard View" is being promoted as common as viewing a window in full screen. After having been sufficiently impressed by the experience myself, I started thinking about new ways such an interface could be put to use.
Back to the Future
The first thought that occurred to me was how VR really is just a return to the old stereoscopic photography used throughout the 19th Century and in the 20th Century for aerial reconnaisance. As a firm believer that field research should always be backed up with equally robust archival work (see notes titled DIY Document Scanning and DIY Time Machine for examples) it occurred to me that VR could be used to extract much more information from historic imagery, especially when many early photos were meant to be viewed in 3D in the first place!
While many may be imagining hand tinted portraits of dead Civil War soldiers when they think of sterescopes, 3D rendering was just as popular a method for capturing panoramas. As in this image of SF from 1851-

One could certainly understand why it would be impossible to appreciate his panorama of the CIncinatti riverfront from 2 dimensions-

This was especially true in early aerial photography where sophisticated Kite and Balloon Mapping rigs had to be capable of lifting heavy panoramic cameras.
This 1860 photograph of downtown Boston, for example, is actually considered to be the first aerial photograph in history!

The usage of stereoscopic photogrammetry to interpret aerial imagery was developed by the British in WW1 and was famously used in WW2 in Operation Crossbow resulting in literally millions of prints of which only a fraction have been digitized.
With aerial imagery becoming more and more accessible, contemporary usage of stereoscopy in the production of aerial images is becoming a frequent issue of discussion. The USGS for example provides stereo pair images by request. Discussions about stereoscopy and photogrammetry are certainly familiar in PublicLab circles and a Stereo Camera rig has undergone various iterations in the PublicLab community since first introduced 3 years ago. Meanwhile, Mapknitter and OpenDroneMap have been incorporating 3D elements into their respective platforms.
Questions and next steps
Does the democratization of Virtual Reality interfaces have any potential application to the field of citizen science? Would widespread adoption have any affect on current grassroots mapping methods? Would further development of a stereo camera help produce 3D mapping imagery? What new insights could be gained by viewing current aerial imagery in 3D?
Please do feel free to reply in the comments thread or via discussion forum.
Updates
The NYPL has a great tool called Stereogranimator which allows users to create 3D viewable content using their collections!
Another reader pointed out an app released by Google encouraging use of VR as a teaching tool- https://www.google.com/edu/expeditions/
Follow related tags:
mapping blog grassroots opendronemap

The Orb of Salisbury
Above: The big white buildings are Maple Meadow Farm in Salisbury, Vermont. The longer ones house 65,000 laying hens. That is big for a shell egg business in Vermont, but nationwide, farms with one to three million hens are not uncommon.
After a morning of mostly successful aerial photography, the kite flying weather only improved, so after lunch I drove a few miles to the village of Salisbury. It was brighter with a steadier wind from the SSE. There are big hay fields south of the village, so the wind was good for lofting the camera over my neighbors' back yards.

He is saying "No experiments this time, just get some photos."
There were fresh batteries powering the SkyShield controller, a full charge on the PowerShot S100 battery, and an empty 4 GB SD card in the camera. The wind was 10-15 mph so I flew the nine foot Levitation Delta. The SkyShield was running Mode 0, the standard routine for the S100 zoomed all the way out. With a steadier wind, the Saturn V Rig was staying in the same place long enough to complete the 75 second routine capturing 25 photos.

The Saturn V Rig under a nine foot Levitation Delta kite.
The flight lasted an hour and a half. But the photography stopped after an hour when the SD card filled up. Although the same card held 1500 photos on Sunday, this time there was no more space after 1221 photos. For some reason the average jpeg size was larger this time. This time many photos were slightly overexposed (because I set the ISO to 160?) and on Sunday many photos were much underexposed (because the sun went down). So that probably explains the difference. I need to start using an 8 GB card.

Part of a half spherical panorama stitched from 25 photos. Salisbury village is front and center.
When the rig landed, the servo motion was erratic because the batteries were low. Although batteries lasted for almost 2.5 hours last time, this time they did not last 1.5 hours. I don't know how to explain the difference. The 2.5 hours included two sessions, so the batteries rested between them. It was cooler this time than last, but only by 10°F or so. More observations are required.
Above is the full resolution little planet (stereographic) projection that is the lead image of this note. You can also see it at gigapan.com. You can use your + and - keys to zoom.
Below is a full resolution half-spherical panorama embedded at 360cities.net (because I still can't upload panoramas to Photosynth). You can also see it at 360Cities.
Village of Salisbury, Vermont
You can hide some of the clutter with a toggle in the upper right. Or click above to view this at 360Cities.net.
Flight notes:
Camera:
- Model: PowerShot S100
- ISO: 160
- Shutter speed: 1/800 second (Tv)
- Focus: manual on infinity
- Focal length: 24mm (eq.)
- GPS: on
SkyShield:
- Version: 2.4 (3-switch DIP)
- Sketch: version 2.08sfm (beta)
- Mode: Mode 0 (for 24 mm lens, 25 photos/cycle)
- Customization: The nadir tilt angle was changed from 20 to 11 so the camera was pointed straight down.
Flight:
- Kite: nine foot Levitation Delta
- Wind: From SSE, 10-15 mph
- Duration: 90 minutes
- Photos taken: 1221
Panorama stitching:
- Software: Microsoft ICE
- Post processing: No adjustments were made to any photos before stitching. ICE's "auto complete" feature was used to create extra sky to fill in missing areas. Panoramas exported from ICE were modified in Photoshop including creating sky to make the 360cities panorama fully spherical (360Cities requires that for viewing in their spherical viewer).
Follow related tags:
kite-mapping vermont kite blog

Formaldehyde Measurement: testing Public Lab's kit with DOH's equipment
Motivation and Background
Formaldehyde is one of the most common indoor air pollutants, and is a known respiratory irritant and carcinogen (for more information on formaldehyde exposure see the wiki here). Meta- and paraformaldehyde are often used in industrial resins for materials like particleboard that are pervasive in many homes. Formaldehyde can offgas from these materials and be an airborne indoor toxicant. While formaldehyde is a known indoor contaminant, information is severely lacking on the concentrations of airborne formaldehyde people are exposed to in their homes.
This experiment is part of the larger Where We Breathe project of Public Lab in which we have been working on a way to make formaldehyde testing affordable so that people can measure formaldehyde in their own homes, build information about common exposure levels, and collect further information about ways to mitigate formaldehyde exposure and resultant health effects. You can see all of the Public Lab research notes about formaldehyde here. We began by building a prototype lower-cost version (by @nshapiro) of the most inexpensive formaldehyde detection method we found in a peer-reviewed publication, which is also one that does not require sending samples to a lab for analysis (which perpetuates hidden expertise and increases opportunities for sample contamination). @mathew and the kits team then began developing two versions of the kit: one sturdy kit that is calibrated and built into a case for dropping in the mail and sharing across a variety of communities, and one DIY kit that is even less expensive than our original prototype by using a DIY bubble flow meter to calibrate airflow. All of our test kits involve have hacking an inexpensive aquarium pump to replace expensive industrial pumps that draw air through detection tubes, lowering the cost of a sampling assembly by ~$2000. There are inexpensive commercially available colorimetric formaldehyde detection tubes (Kitagawa 710 tubes, ~$7 per tube), that measure formaldehyde through a color-change reaction between formaldehyde and hydroxylamine phosphate in the tube. The manufacturer’s information sheet states the tubes are precise to 10%, though interestingly, it makes no claims of the tubes’ accuracy. Since the reaction inside the tubes with hydroxylamine is not selective for formaldehyde, other ketones and aldehydes will have a similar reaction. Acetone and acetaldehyde are potential co-contaminants that could thus interfere with the measurement of formaldehyde, causing erroneously high formaldehyde concentration readings.
Experiment
In order to assess the accuracy of our formaldehyde detection kit (including the modified aquarium pump and Kitagawa 710 tubes), we co-located our equipment with federally accepted equipment of the Department of Health in Rhode Island, which included 2,4-dinitrophenylhydrazine (DNPH) -coated silica gel cartridges and followed the EPA federal reference method TO-11A for sampling and analysis. Analysis of the DNPH tubes by UV-HPLC provides quantitative data regarding the concentrations of formaldehyde, acetaldehyde, and acetone in the air sampled. The Rhode Island DOH donated 10 cartridges for us to use in our comparison tests.
With 10 DNPH cartridges, we were able to test both accuracy and precision of our formaldehyde kit by collecting three samples in each of three different homes (plus a fourth sample in one home). We set up both instruments at approximately 3 ft above the floor on various pieces of furniture. Prior to going into the field, we calibrated each instrument to the appropriate flow rate, which was 300 mL/min for our Public Lab formaldehyde kit and 1L/min for the DOH assembly. In the homes, we set up the DNPH cartridge and Kitagawa tube in quick succession to minimize exposure to the air prior to official sampling. We simultaneously turned on the pump for each instrument and recorded the time. After either 30 minutes or 10 minutes, depending on the appearance of the Kitagawa tube, we turned off the pumps, capped and stored the DNPH cartridge, recorded the temperature and relative humidity, read the formaldehyde concentration on the Kitagawa tube, made the appropriate temperature corrections, and photographed the Kitagawa tube and its documentation sheet. All tubes and samples were stored in a cooler on ice. After the first round of samples (one using the Public Lab kit and a simultaneous one using the DOH instrument) were complete and recorded, we set up the second samples within 20 minutes, and third samples in similar fashion.
We tested three homes with laminate flooring, where the age of the flooring ranged from 1 to 4+ years. The houses are listed as Site 1, Site 2, and Site 3; the sample rounds are listed as A, B, and C. At Site 2, sample A was above the maximum concentration detectable by the Public Lab kit, which is why that data point is not included in the graphs of the data below, and is listed simply as >95 ppb in the table below. At Site 1, all three samples were collected in a bedroom with a closed door. At Site 2, samples A, B, C were collected in an open living room and sample D was collected in an upstairs bedroom that was open to the atrium/living room. At Site 3, samples were collected in a large basement. Public Lab kit field blanks were also collected and were below the quantification limit.
Results
The data collected is listed in the table below. All concentrations are listed in parts per billion (ppb), which can be converted to μg/m3 by multiplying by the molecular mass and dividing by molar volume of the molecule (i.e. formaldehyde). Note that the column labeled “% Error” is the percent difference the Public Lab formaldehyde kit measurement is above the DOH cartridge measurement value for formaldehyde. The accuracy of the Public Lab formaldehyde kit measurements was not as good as we had hoped, with errors ranging from 20 to 70%. The highest errors (59-70%) were in a house where there was an abnormally high concentration of co-contaminants, but even when co-contaminants were in a more “reasonable” range, the Public Lab kit had errors from 21 to 46%. The reproducibility of measurements at any given site is quite good, however: the relative standard deviations were less than 7% at each site. This may indicate that the Public Lab formaldehyde kit could be useful as a qualitative tool monitoring formaldehyde concentration trends at a given site, with a given air chemistry (e.g. co-contaminant load). This bodes well for use alongside the formaldehyde plant-based remediation kit, to estimate the effectiveness of the remediation effort.
Graphs of the data are below the table. It appears as though there is a strong linear correlation (y = 1.87x - 27.05; R2 = 0.99) between the Public Lab formaldehyde measurement and the DOH formaldehyde measurement, even though the percent errors are high. Interestingly, there do not appear to be correlations between the % error and the concentration of acetone or acetaldehyde (or their sum).
Questions arise from this exercise, including:
(1) Is this apparent correlation between the Public Lab and DOH formaldehyde measurements real, or due to an artificially weighted regression from the high (>100 ppb) formaldehyde concentrations? How many co-located samples would we need to build a robust empirical correlation?
(2) Is it possible to quantify the effect of acetone or acetaldehyde on formaldehyde detection in the Kitagawa tube? Without distinct measurements of acetone or acetaldehyde, we would be setting up a situation with equal numbers of variables and unknowns, so the equation would have infinite solutions, but could we present basic ranges that would be realistic for each variable?
(3) Are the % Errors perhaps correlated with the width of the Kitagawa tube opening, which is unique to each tube because we have to score and break it, so there is user error and variability. I’m going to borrow a caliper to measure the tube openings and will report back if there is a correlation. The flow rate did not appreciably change between tubes with different size openings though.
(4) Where do we go from here? Can we use these tubes to gather quantitative data, or are we relegated to qualitative data (which can also be very useful)?
We appreciate any and all thoughts and ideas!
| Public Lab | DOH | DOH | DOH | |||
|---|---|---|---|---|---|---|
| Sample | Site | Formaldehyde | Formaldehyde | %Error | Acetaldehyde | Acetone |
| ppb | ppb | (PL-DOH)/DOH | ppb | ppb | ||
| PL1A | 1 | 58 | 43.2 | 34% | 15.2 | 48.8 |
| PL1B | 1 | 56 | 43.2 | 30% | 14.1 | 49.2 |
| PL1C | 1 | 51 | 42.1 | 21% | 13.5 | 52.2 |
| PL2A | 2 | >95 | 115.8 | xx | 50.2 | 903.6 |
| PL2B | 2 | 192 | 115.6 | 66% | 53.8 | 901.8 |
| PL2C | 2 | 192 | 121.0 | 59% | 52.6 | 905.3 |
| PL2D | 2 | 176 | 103.2 | 70% | 52.3 | 924.5 |
| PL3A | 3 | 95 | 64.9 | 46% | 37.0 | 50.2 |
| PL3B | 3 | 92 | 67.1 | 37% | 40.4 | 61.2 |
| PL3C | 3 | 92 | 67.9 | 36% | 40.3 | 61.1 |
Follow related tags:
air-quality blog formaldehyde wherewebreathe

When $100,000 is not enough: how citizen data (could) relate to government regulation
October 29, 2013: The headline on airhugger.wordpress.com reads: “Houston we have a problem: Six little inches of air will determine whether millions of dollars will be spent to clean up the air of millions of people in the Oil and Chemical Capital of the World.”
From the front porch of a single family home in Galena Park, Houston, the sights and sounds of industry come from all around: diesel trucks revving and idling, the clank of cranes setting down new sections of pipelines, the screeching brakes of trains loaded with Bakken Crude Oil, the low tones of container ship horns.
Below, Galena Park with industry in the background. Houston Chronicle, August 5, 2014:

Galena Park is a predominantly Hispanic, low-income area of approximately 3,000 households living in single family homes located along the Houston Ship Channel.
The community’s commercial strip, Clinton Drive, is also the thoroughfare for all truck traffic generated by the Port of Houston and the many facilities along that part of the Houston Ship Channel. On average, Clinton Drive see several thousand diesel trucks daily. The high traffic roadways and petrochemical refineries expose the under-resourced neighborhood to significant air quality impacts from fine particulate matter (PM2.5) even as economic tightening and technological advancements have reduced the number of jobs available to those who live nearest this industrial cluster.
Being that the Houston-Galveston region is such a heavily industrialized area, the EPA closely monitors air quality via an array of regulatory air monitoring stations. And although Galena Park has a PM2.5 regulatory monitor right on Clinton Drive, community members will quickly point out that it is outside of the city’s primary residential areas. Clinton Drive runs alongside the shipping channel by Galena Park about a mile to a mile and a half outside the residential area where the bulk of homes, the elementary, junior, and high schools, Early Head Start, and Recreation Center host most of the population. The sources of PM2.5 are closer to the neighborhood than the monitoring station is.

There are two Federal Regulatory Monitors at the Clinton Drive site, a pump which draws 16.67 liters of air per minute through a 3” intake continually over a 24 hour duration, and a filter which collects physical samples to be weighed. The City of Houston and the City of Galena Park have made specific landcover improvements in the vicinity of the regulatory monitor that were not made in the neighborhood, such as planting trees in the median of Clinton Drive and paving nearby parking lots, both of which have the effect of keeping the dust down. For these reasons, the Galena Park community has longstanding concerns that the regulatory monitor is not reflective of the airquality within the actual community.
EPA long term data for Galena Park shows annual averages of PM2.5 hovering at 11.6 micrograms per cubic meter, just below the annual threshold of 12 μg/m3, which would be a violation of National Ambient Air Quality Standards (NAAQS) (http://www.epa.gov/ttn/naaqs/criteria.html), as authorized by the Clean Air Act http://www.epa.gov/air/caa/.
Clinton Drive’s hourly real time data is published here (https://www.tceq.texas.gov/cgi-bin/compliance/monops/daily_summary.pl?cams=403) by the Texas Commision for Environmental Quality, accompanied with the following text:
PLEASE NOTE: This data has not been verified by the TCEQ and may change. This is the most current data, but it is not official until it has been certified by our technical staff. Data is collected from TCEQ ambient monitoring sites and may include data collected by other outside agencies. This data is updated hourly. All times shown are in local standard time unless otherwise indicated.
TCEQ data shows variability including peaks at times that seem to correspond with early AM diesel truck traffic and idling:

Notice PM 2.5 at the bottom row of parameters.
This hourly data shown here gives us a moment to consider that EPA 24 hour standards allow for much higher values of 35 μg/m3. This leads to a question often posed by fenceline communities, “Considering that some days the industrial campuses are not operating, and are releasing zero emissions, how many 0.0 μg/m3 and 35 μg/m3 days combine to create a 12 μg/m3 annual average? What is our actual health exposure to particulates?”
But back to the main story: If airborne PM2.5 were to have an average annual concentration above 12 μg/m3, then the federal EPA could assert authority, requiring Texas to draft a new plan to ensure that it will achieve the NAAQS standards, which would likely incorporate stricter emissions permits. Stricter emissions permits may require substantial technological upgrades or expensive operational changes, and therefore are generally met with resistance from industry groups; however, quoting Brian Butler, “Sometimes cost is the argument i hear from some industries about why they can’t do environmental improvements. But we have seen examples in the past where some industries have been able to recapture their investment in mitigation technologies through improved operational efficiency and reduction of loss of product.” Citizen groups also could take action to file against the Texas CEQ or the federal EPA for failure to take the actions available to each respective agency to uphold the Clean Air Act if the Houston air were not in attainment of the NAAQS (e.g. higher than 12 μg/m3 PM2.5 over a year).
Therefore, beginning in 2012, seeking to both understand and address air quality conditions in Galena Park, regional environmental advocates Air Alliance Houston (AAH) and international environmental health and justice non-profit Global Community Monitor (GCM) undertook a community health impact survey, a community mapping workshop, and a community air monitoring project.
Monitoring details
To skip ahead, we’ll present what data was actually collected by what methods: GCM and AAH conducted air monitoring over the course of a year for fine particulate matter and elemental carbon (a surrogate for diesel pollution) at four community-selected sites inside the Galena Park residential neighborhood. In total, over $100,000 was spent. The equipment and methods involve two MiniVol11 Tactical Air Samplers (TAS) http://www.airmetrics.com/products/minivol/index.html and laboratory analysis of the MiniVol filters, 47 mm Teflon filter media which has been approved by the United States Environmental Protection Agency (EPA) (link to 1999 study http://www.airmetrics.com/products/studies/1.html, and look out for FRM documentation links later in this post).

It is fair to ask, why would a community group invest so much money in MiniVols? Global Community Monitor reports that Quality Assurance Protocols for the MiniVol have been approved by the State of Oregon Department of Environmental Quality and the State of Delaware Department of Natural Resources and Environmental Control. There is a monitoring project underway in Oregon with a DEQ approved plan, with one minor note that “because of the lower flow rate of the MiniVol, the minimum detection limits (MDLs) will be higher.” http://www.whatsinourair.org/2014/10/28/chapman-air-monitoring-plan/#.Vgw7oWRVikp Discussions are underway with some of the State of California’s Air Districts and EPA Region 9 that would mandate follow-up research to be conducted by the agencies if community submitted data from MiniVols or buckets indicated levels exceeding regulatory standards. Additionally, MiniVols are accessible because many state and county health departments own them and in some cases have loaned them to community projects, as in Albuquerque New Mexico to the South Western Organizing Project (SWOP).
Exhaustive details of the monitoring protocol excerpted from the final report issued by AAH can be found here: http://publiclab.org/wiki/galena-park-monitoring-report#B.+Monitoring+Equipment+and+Analysis+(Page+13+of+the+PDF)
Interestingly, in the Galena Park study, there was no statistical difference between community-collected MiniVol data and the TCEQ’s data. Stepping aside from the long standing debates between how government averages are calculated over periods of year(s) (for both pollution and human health response to exposure levels) versus how communities experience hotspots / peak events, the statistical similarity means that to some extent the MiniVols were on point. And yes, the community and several doctors continue to be concerned about the high peak levels of particulate matter. But here is where this post takes a different turn because those issues are not what the EPA addressed in their response to AAH’s submission:
The EPA wrote a response titled “Responses to Significant Comments 2012 Annual PM2.5 NAAQS December 17, 2014”, in their document “PM 2.5 Desig RTC EPA-HQ-OAR-2012-0918-0337-1.PDF,” Section 3.2.4. EPA Region VI. The following is reprinted from page 56 of 68:

Comment: The commenters questioned whether the monitoring data obtained at the [EPA] Clinton Drive Monitor site is representative for the Galena Park community and submitted monitoring data gathered from five monitoring sites operated by Air Alliance Houston at various locations within the community (see Figure 2 below). The commenters believe the Air Alliance monitoring data demonstrated that the Clinton Drive [EPA] monitor was not representative of area air quality and that the area could be in violation of the NAAQS.
EPA Response: We first note that we must consider all valid data within the relevant 3- year time frame that is collected in conformance with the Federal Reference Methods and siting requirements in our designation decision. As discussed below, the Clinton Drive monitoring site meets these requirements and therefore, must be considered. The location of the Clinton Drive monitor conforms to all applicable siting criteria, as set forth in 40 CFR Part 58, Appendix D and E, and has been approved by the EPA as part of TCEQ’s most recent Annual Monitoring Network Plan and 5-year Monitoring Network Assessment. The Clinton Drive monitor is approximately 1.5 miles from Galena Park, as shown in Figure 2. At Clinton Drive, TCEQ operates PM2.5 Federal Reference Method (FRM) and non-FRM continuous monitors.
With regard to whether the data collected by Air Alliance Houston indicates a violation, Region 6 evaluated the monitoring data submitted by the commenter. Approximately 29 discrete samples were collected in the Galena Park community over a 16-month period from May 2012 through September 2013, thus the data is limited in scope compared to the data collected by regulatory monitors over a 3-year period and subject to data completion criteria. Additionally, these data were also not monitored and collected according to the requirements of the federal reference method for PM2.5 found in 40 CFR part 50, Appendix L. Our designations must be based on valid 3-year design values, and even if the monitoring data submitted by the commenters fully complied with the siting and data quality criteria, there are not sufficient data on which to derive a valid, 3-year design value.
Therefore, these data do not affect our decision to designate the area as Unclassifiable/ Attainment.
End Quote. Short story: despite the alignment in data, the EPA’s dismissal of the project because the tool and methods were not FEM/FRM (see below) appears to be undercutting the EPA’s own rhetoric of funding and working with EJ communities collecting citizen science data.
Oh and in case anyone’s looking for 40 CFR part 50, Appendix L, check page 84 of 91 in http://www.epa.gov/ttn/naaqs/standards/pm/data/fr20061017.pdf or here https://www.law.cornell.edu/cfr/text/40/part-50/appendix-L

In response to the response given to the AAH Galena Park monitoring project by the EPA, Brian Butler of AAH presented the above poster at the July 2015 EPA Community Air Monitoring Training workshop, and says,
”I wrote the title “What’s the Use?” as a double entendre expressing the futility of collecting data that won’t have impact and to also pose a honest question to the EPA.”
As writers of this post, we are wondering out loud about this kind of response from the EPA. During a time where the EPA awards grants to conduct citizen science under their Environmental Justice program area. and much time and effort is then spent by communities collecting data on environmental quality, a dismissive response like this seems patronizing and like an opportunity was missed for more collaborative environmental management.
NB: Please see a quick background on the EPA prepared for this blog post here: http://publiclab.org/wiki/usepa
Where does citizen data fit in the realm of EPA assessment and enforcement?
Not an exhaustive list, but the biggies:
- Citizen Science In the Adirondacks has been directly funded by the EPA as part of its assessment plan: http://yosemite.epa.gov/opa/admpress.nsf/eeffe922a687433c85257359003f5340/8c8f002317304c8f85257c3d0068ed08!opendocument
- Citizen Science in Tonawanda was independently conducted (using GCM Buckets), eventuating in an EPA enforcement action and a criminal conviction: http://yosemite.epa.gov/opa/admpress.nsf/0/5CF8163B1864025E85257B720055A5BB
- Citizen Science in Newark’s Ironbound used truck counts to appeal to local authorities to change regulations around truck traffic and idling. The EPA is now bringing their own sensors in. http://www2.epa.gov/air-research/ironbound-community-citizen-science-toolbox-fact-sheet
- Less officially, Citizen Science in the Superfund CAG Gowanus was independently conducted by multiple groups who submitted multiple types of data to EPA through the CAG, with the result that the Superfund Phase 1 assessment was greatly informed by local expertise about existing outfalls, and the Superfund boundary was expanded to restore an additional city block of wetlands.

Federal Reference Method & Federal Equivalent Method
drumroll please..."And at last we come to FRMs and FEMs"
FRM: Federal Reference Method FEM: Federal Equivalent Method
Title 40, Part 53 of the Code of Federal Regulations (40 CFR Part 53): http://www.epa.gov/ttnamti1/files/ambient/criteria/reference-equivalent-methods-list.pdf Title 40 CFR 53.1 - Definitions: https://www.law.cornell.edu/cfr/text/40/53.1
Definition of FRM: Federal reference method (FRM) means a method of sampling and analyzing the ambient air for an air pollutant that is specified as a reference method in an appendix to part 50 of this chapter, or a method that has been designated as a reference method in accordance with this part; it does not include a method for which a reference method designation has been canceled in accordance with § 53.11 or § 53.16.
Definition of FEM: Federal equivalent method (FEM) means a method for measuring the concentration of an air pollutant in the ambient air that has been designated as an equivalent method in accordance with this part; it does not include a method for which an equivalent method designation has been canceled in accordance with § 53.11 or § 53.16.
Definitions don’t quite capture “purpose”, so although it may seem obvious, let’s rhetorically ask why we have FRMs and FEMs? First and foremost, we have FRMs and FEMs because we want the highest quality data to inform us about our environment. The EPA also has liability to consider, and wants to ensure that the data underlying its assertions or actions are highly defensible. This is logical from a regulatory standpoint and an enforcement standpoint.
Issues arise, however, as we return to Appendix L and read that FRMs specify branded and trademarked technologies and list individual manufacturers of the devices needed to assess air quality. https://www.law.cornell.edu/cfr/text/40/part-50/appendix-L

Restating this, the current status is that to collect regulatory quality environmental data, one must use blackboxed, patented products. Many patented technologies are commercialized to sell at prices that are inaccessible to most citizens, and thus there is a huge financial barrier disabling the public from gathering data and producing "valid" information. But this is the type of tech development (closed source, patented, expensive) funded by the EPA and established as the standard for environmental assessment. Requiring FRMs or FEMs for even the lowest screening-level assessments unnecessarily impede the ability of citizens to collaborate with environmental agencies in the monitoring of their local environments because FRMs and FEMs are too costly and time-consuming for persons other than official government personnel to perform.
Before even getting to phase where products are named and sold, there is a research and development phase yielding results on how technology works that could be published openly. There are many open source innovators eager to collaborate with the EPA that are hindered simply by closed publishing. In one anecdote from 2013 and 2014, the EPA excitingly came very close to supporting this space when they ran an assessment of low cost, air quality sensors being used in the DIY and citizen science communities, and published the summary results in the Air Sensor Guidebook http://cfpub.epa.gov/si/si_public_file_download.cfm?p_download_id=519616. But, under the http://www2.epa.gov/ftta/collaborating-epa-through-federal-technology-transfer-act, the EPA was able to request that companies send in their devices for testing, perform an incredible amount of very valuable comparative testing, yet not release any of the actual data that could help citizen innovators learn how technology in this space was performing and spur open source innovation.
Why does the EPA distribute and use funds for closed source development? In some ways, it is a result of a worldview that holds that patents spur technological development through the future profits available to those who invest in research and development. http://www2.epa.gov/sites/production/files/2014-05/documents/ip-factsheet.pdf. But open source, commons-based peer production offers another path for spurring innovation.
Consequences result from this patent regime: as things currently stand, there’s simply no way for citizens and government to speak the same language on air quality. In an age of open data, we argue that “gov can dish it but can’t take it” (Barry, 2012). But it doesn’t have to be this way.
Air Alliance Houston is concerned that their time and money, and that of other grassroots groups, is being wasted because there is no pathway for community-collected data to have impact at the enforcement level. As Brian Butler writes, this is a serious issue of the EPA contradicting itself, or worse, patronizing EJ communities through offering citizen science grants just to go through the motions of a potemkin process. Clearly, technology is a fast moving space, and we are in an awkward period where the EPA’s proverbial door is opened to citizen data, but it can’t come in.
We need pathways for citizen and community collected data to connect to agency regulatory action
Perhaps modeled after QAPP levels, evidence levels could be established, and a place for screening to prompt further action. A suggestion along these lines has already been made in the EPA’s 2014 Air Sensor Guidebook report, though it is incomplete as it mostly discusses relative standard deviations that could be appropriate and does not include a pathway for driving action or response from the government at any level.
Here are some larger ideas around supporting innovation and citizen <-> government collaboration that have been informed by positions articulated by Mathew Lippincot @mathew :
- results from federally funded research must be published in journals that do not require paid subscriptions to access, and the data from the study be published in open formats
- federally funded tool development should not be patentable
- additional federal funds for commercializing patented tech should not be awarded
Imagine with us for a moment how this might play out ... the EPA might become a steward of open source reference designs for environmental assessment technology. EPA-stewarded designs might specify performance criteria rather than branded and patented technologies. Data captured by these new “Open Federal Reference Methods” might be stored in open formats, with no specialized or closed source technology required to access it. Technology for environmental monitoring gets better, cheaper, and more accessible. Communities and agencies begin to speak the same language, cease wasting time arguing and move forward together on understanding and improving environmental quality.
In the US alone, thousands of individuals and communities are exploring open source environmental monitoring and are hungry to collaborate with the EPA. In the final tally, what’s at stake is human health and our combined abilities as community plus government to ensure environmental quality.
Follow related tags:
gulf-coast air-quality blog regulations

EJ in LA
Lead image: EJScreen Snapshot of Baton Rouge, LA under the Environmental Justice Indicator: Number of facilities within 5k with potential chemical accident management plans.
There have been a number of conversations lately on the national level about Environmental Justice (EJ) and the new tools (particularly EJScreen) and strategies (EJ 2020) that aim to address EJ issues. Many of these conversations have specifically invited community groups and interested parties to the table for the EPA to introduce the new resources, and provide a space for comments. There is a genuine interest to explore if those tools and strategies:
1) reflect what is happening on the ground, 2) protect the right people, and 3) will support outcomes that stymie the perpetual exploitation of marginalized groups.
Without getting into the nitty gritty of these new resources and what they do (although I’d highly recommend taking a look at them), one interesting sidebar is in the relationship of this broader topic to states, Louisiana for example.
To say that Louisiana is a hot spot for EJ issues is an understatement. Zooming into this map from EJAtlas.org, it’s easy to see why these conversations are so important here.

Disclaimer: the information on this map depends on the information the group receives from partners and collaborators.
States are federally required to include environmental justice considerations in legislation under Title VI of the Civil Rights Act. Yet, in a cursory search of the Louisiana DNR and the DEQ sites and policies, the only mentions of “Environmental Justice” is in comments they have received in response to public hearings…am I missing something? In a state where EJ issues are some of the most prevalent in the country, state regulatory agencies have been evading the issue.
In a webinar on the EPA Federal Interagency Agency Working Group (EJ IWG), there was discussion on Title VI, and Executive Order 12898, yet when faced with the question “Is there anything that dictates that states must recognize EJ issues in their policy?” The answer is: “well it’s different state to state.”
The federal government is doing interagency work but when it’s doesn't bring state accountability, where should people turn for answers on community EJ issues that are embedded in state policies that don’t protect people? Faced with this question, the EJ IWG answers that there is a hotline (800.962.6215, open 8-5:30pm ET) where people on the federal level will respond, and that they are working on providing trainings on the state level, building networks there and bringing in organizations. They are even taking public comments via email (ejstrategies@epa.gov)
But “EPA is required, by law, to implement a program in states that have never assumed responsibility for programs in the first place.” (EPA and the State's: Environmental Challenges Require a Better Working relationship, Steve Elstein, Eugene Wisnoski, Lisa Pittelkau. 1995) Maybe they are looking in on it, and at least there are conversations surrounding a “Louisiana Environmental Justice Collaborative Action Plan” -draft- by the EPA.
But where is the state?
Follow related tags:
gulf-coast louisiana blog gulfcoast