The Public Lab Blog
stories from the Public Lab community
About the blog | Research | Methods

Frac Sand Frisbee- Maps against Mines
Mikey O'Connor's blog, Frac Sand Frisbee does an excellent job of explaining the problems with frac sand mines in Buffalo County, Wisconsin, and with providing resources to others to replicate a campaign against the mines. I highly recommend it. Images here are used with permission from Mikey.
Buffalo County has largely stopped frac sand mining in its tracks, based on strategies of attacking the long-term financial viability of mining, the impact on roads, the problems of increased truck transport, and most importantly, preservation of the scenic and rural character of the county.
I was drawn to the maps that Mikey makes to illustrate transportation problems and land use discrepancies in mine applications. I'm also fond of collecting mapping resources from non-GIS professionals to assist in designing the new annotations system for Mapknitter.
When asked about the maps, Mikey said that they have been the second most effective thing he's put together. (The first is below)
Two techniques stand out: First, the use of overlays, being able to drop one map on top of the other to show the differences. Mikey said that this is kind of a pain in Powerpoint:

here is a traced overlay to simplify and drive home a point about the discrepancy in land use plans:

Second, using clear and simple symbols on an uncluttered map. These arrows and target to talk about the distances trucks will travel to transhipment facilities:

The Most Powerful strategy: Pictures
The First most powerful thing Mikey presented was a photograph and comparison of the Segerstrom Mine with other proposed sites:

"Just walk that photo around a hearing and everyone hushes up and the mine guys look at their feet," Mikey said. The hillside is too steep to be reclaimed after mining. Such is the power of images.
Follow related tags:
community-mapping mapping blog fracking

mapping urban biosphere in Jerusalem
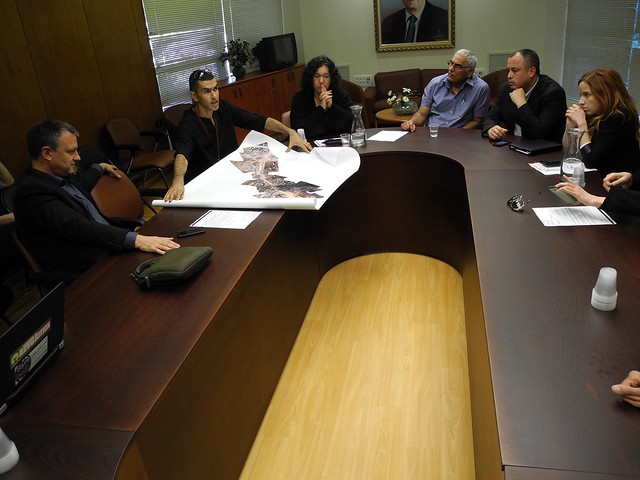
As part of a joint project named "Maree-Makom" (Hebrew for Reference, literal translation is See Place) I am working together with the architecture department in Bazalel, art and design academy in Jerusalem, and community centre "Yuvalim" which administrates a few neighborhoods in south west Jerusalem. The project combines design studio and research seminars, trying to develop tools for urban renewal in poor neighborhoods that would allow us to think and do beyond the neo-liberal paradigm of "urban growth". We are a small group of 4 students (from the departments of architecture and visual communication), two architects from Bezalel (lecturers), an urban planner and community social worker who both work full time in the community centre, focusing on the issues and problems raised by the massive urban renewal plans in the area. I am contributing from my experience with mapping techniques and engaging residents using civic science practices.
We are about to map a valley in Kiryat Hayovel, called "Vadi Hayovel". It is a fascinating environment that the residents and the community centre seek to preserve and explore, they plan to document and map it with the intent to strengthen their participation in shaping future municipal decisions that would determine its development and use.
We want to create a photographic map of the valley that would allow to identify the special plants that grow there, flowers, waste areas, architectural and agricultural remains of the Palestinian village that was there prior to 1948, ancient archaeological remnants, pathways to the valley, and a porcupine cave known to be there somewhere...
We think about using the infra-red camera, and also to collect information on the ground using geo-tagged photographs. I remember this research note about Rhus, open source mobile GIS for community ecology - would love to hear from those who had experience in using it.
Let me know if you have any other ideas on collecting data within urban biospheres with easy and accessible tools, or references we can look at.
Follow related tags:
balloon-mapping photography jerusalem kite

Public Mapping Mission - Newtown Creek
The Mapping Event
Part two of the Public Mapping Mission was a combination online/offline course and a collaboration between the Public Lab, GovLab Academy, the Center for Urban Science and Progress and the MIT Media Lab. The second part of the course was a public event in which participants mapped Newtown Creek on December 7th. This is their story...
After a rainy and cold Friday night, the forecast for Saturday afternoon was looking much better. High of 41ºF with 10-15mph winds from the west, and indeed it was a clear, cold and windy day. Our group of dedicated mappers met at Newtown Creek at the Plank Road site in the afternoon. We were carrying two kites, two Public Lab balloon kits, an 80cf tank of helium and other miscellaneous supplies.
Shortly after our arrival on foot, an armada of canoes from the North Brooklyn Boating Club arrived, reinforcing our efforts and providing naval support. From our location at the Plan Road site, the wind was coming down the creek putting us downwind of our proposed mapping area. This made flying either a kite or a balloon from land impossible. We therefore decided to use the balloon with the canoes.

We quickly began to prepare the camera rig and helium balloon for flight. Given the windy conditions, we wanted to put as much helium in the balloon as possible to give us maximum lift despite the strong winds. Due to the cool weather, the helium condensed in the balloon as we were able to fill the balloon with all 80cf of helium. I repeat, we put all 80cf of helium into the balloon. (I did not know that was possible).

Once we got the balloon into the canoes, the skilled paddle-men (and paddle-women), navigated upstream against the wind in order to allow the balloon to sail with the wind down the creek. The was an extremely challenge moment, paddling against the current and against the wind, all with a 6ft helium balloon dragging in the wind. Kudos to the seamen!!!

Arriving at out proposed destination, we launched the balloon as high as we could. Given the strong winds, it was incredible difficult to hold on to the balloon. The balloon and camera were bouncing around the entire time.

Finally, after about 20mins of flight, we were nearing a bridge and decided to bring the balloon back in. This was no easy task and the balloon nearly entered the water several times. The threat of losing our camera rig was very real. Fortunately, with support from a second canoe, we were able to safely bring in the balloon without losing the camera or capsizing the canoes.
Unfortunately, during take-off, the camera slipped in the housing and began to take images of the container. This left the majority of the photos useless to make any type of map. Note: The has been the second time a camera has slipped in the housing. Experimenting needs to take place to resolve this issue.

Special thanks to the North Brooklyn Boating Club, Cosmo from the GovLab, Eli from World Science Festival, Liz Barry and Cristina Tortalla.
About Newtown Creek
Newtown Creek is on of the most polluted waterways in the country and is the location of one of the largest oil spills in US history, leaking between 17 to 30million gallons of oil and petroleum products into the creek. As early as the 1800's, the creek was used as an industrial waterway and as an easily accessible port and canal between Williamsburg and Queens. In the 1900's, the creek was one of the busiest industrial port on the east coast housing numerous chemical plants, fertilizers factories and oil refineries.
Currently, Newtown Creek is being deemed a superfund site by the Environmental Protection Agency providing federal funds to help clean and restore the creek.
Public Mapping Mission Online Course
Part two of the Public Mapping Mission online course will be dedicated to mapping parts of Newtown Creek on Saturday, Dec 7th starting in the afternoon. This event will begin at 11am with an online overview of balloon/kite mapping and then will move into the real world by mapping Newtown Creek. Following the mapping, we will return to the online course to share our experience and results. For those interested in participating, sign up here.
The Public Mapping Mission online course is a collaboration between various organizations in an effort to promote citizen science and public participation in local environmental issues. The course launched on Nov 22nd. with an online overview of current citizen activities and techniques being used to address local problems. The Newtown Creek mapping will be a followup and final event in the course.
Old School Maps of Newtown Creek
1844:

1860:

1891:

Unknown:

Present Day:

Follow related tags:
new-york-city education newtown-creek event

"where do the maps go?"
I wanted to share some thoughts that became clearer to me now, a month or so after the barn raising gathering (Oct 2013), in which these issues were discussed by some of us. The bottom line of what I am about to share here is that I realized that the challenge I face now in order to make the work I've been pulling through in Jerusalem more significant for the communities I am working with, is dealing with the problem of design. To say it more clearly - community engagement ends right where the need for design begins.
The decoder is the insider
What I am talking about relates specifically to grassroots-mapping using DIY aerial photography tools, but I am sure this can be as true with other open tech and DIY tools and methods. The basic premise is that aerial photographs do not speak for themselves. And in particular those made by communities. Exactly like any other form of photography aerial images are ground for interpretation, rather than for objective decoding. The well established ideas and professional practice of “decoding” aerials is based on and perpetuates patterns of exclusion. S/he who's trained to decode is an insider by definition, a professional in the service of powerful interests. I know this is not knew for you, Jeff Warren and Public Lab did a lot for developing an annotation tool that can be quite useful for storytelling. But I think digital annotation is only one aspect of what we need to do for re-shaping the aerial for community storytelling and making it more accessible and engaging tool for triggering change.

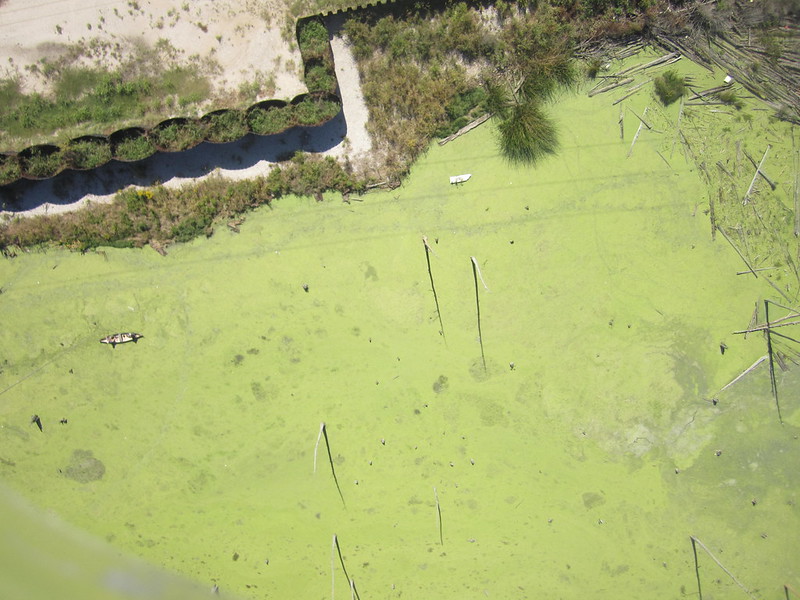
above: east-providence-pond-view-map, mapknitter.org
The story of the Road
A friend of mine has been an aerial photography decoder for the Israeli army during her obligatory years of serving as a soldier (between the age of 18-20). She learnt the skills needed during her service, and she recalls that what she was supposed to produce for her commanders at the time, was to create what was called in military jargon “Sipur Derekh”, Hebrew for “the story of the road”. Her mission was to find the best way for soldiers to cross through a land they didn't know, mostly during night-time, for the purpose of take-over. Through the “Sipur Derekh” she constructed, the soldiers had to be able to know the area as good as a local person does. She used to hover, fly, above the aerial images, cross-examining the same place by using aerials taken at different times. It involved a great deal of imaginative work, juxtaposing clues on the natural features with traces of human activity and life in the place. She particularly mentions the huge gap between her imaginative flight above the area and the extreme reduction of the 'Sipur Derekh' she had to construct and pass on.
mapping the unseen
As I see it, what we, as grassroots-mappers, are looking to do is to invert this power to take-over – which is today being exercised in all sorts of ways (ranging from war and conflict through urban planning and the industries' environmental damages). The story of our road, contrary to reducing the meanings of an aerial image in the service of a narrow interest, is one that seeks to reveal social and environmental context through collaborative mapping. It is not only about an objective reality to be visualized and decoded, but about mapping and thus seeing the subjective story that is embedded in and is inseparable from the concrete features of geography.
above: Ala Salman who created an aerial map of a contested road that splits his neighborhood in two and damages its environmental and communal infrastructures, presents his DIY aerial image to MP's in the Israeli "Kneset".
stand by its side - give it voice and knowledge
The people I was working with had a story to tell on top of that aerial photograph they created. They re-appropriated 'the master's tool', the same tool that is being used in order to erase their presence and identity off the map, or to rationalize plans for destruction and regeneration in the city that ignores their local perspectives. They have created aerial photography in Silwan, Beit Safafa or in Ein Karem, but they had to stand, physically, right beside it to give it their voice and knowledge. The questions that arise once they leave the aerial by itself into the offline and online streams of information, is who will it reach, what story will it tell, or as Catherine D'ignazio phrased it nice and simply “where do our maps go?”.

growing a long tail for mapmaking
In our ethics and politics discussion during barn raising, Liz Barry was mentioning that we need to think of the long tail of community engagement in open-tech and support the local groups we are working with, towards meaningful change. As I said in the beginning, what became clear to me is that we have to work on developing this long tail, which I think raises problems of design in visualizing information. In Silwan we created this integrated poster map that included text and photos the children we worked with created, but we had to have a designer to do that cause the task of turning all this information into a coherent and attractive poster was too complex. Looking at the poster we produced one can see that we have a lot more to learn - and on that note - here is an excellent and inspiring guide for visualizing information for advocacy.
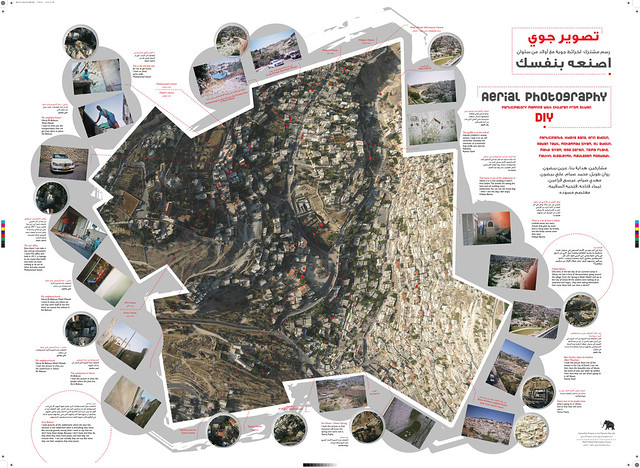
above: Annotated aerial map of Silwan created by children living in the village (East Jerusalem)
re-shaping the aerial
But why should open tech end when it gets to questions of design? Can we think of a workflow that would enable local groups to go beyond creating the object itself, the aerial photograph, to a process of re-shaping the aerial image? I imagine re-shaping its uses, meanings and appearances in everyday life both online and offline. Especially when talking about community engagement we want to create a movement between offline, analog activities to online and digitally-based engagements.
don't just stand by - step on it, jump on it, draw on in
I imagine it not only as a post-production activity but as a public event. Maybe we need to think about prototyping machines and sensors that allow to annotate in public space by anyone who passes-by, by stepping on the image, writing and drawing on it, and turning these bodily actions to digital input that can be later be ground for online engagement.
where do we go from here?
This is to share my thoughts with you at this point in time, hope to attract the interest of some of you to continue this further. I think that once we will be able to create a workflow for telling a story using DIY aerial photography, these community-based maps would be useful not only for advocacy and representation, but also in wider range of everyday uses. Namely, for navigating in the actual geography, in quite a different way than conventional maps allow us today, from the point of view of its inhabitants. Not taking-over that point of view, but embracing it.

above: click the photo for a close-up, to read a detail of children's annotations on the DIY Silwan aerial map.
Follow related tags:
balloon-mapping kite-mapping jerusalem annotated-maps

[organizing] Mapknitters Gulf Coast --first meeting
what's up
Some of us on the Gulf Coast got together to hang out on mapknitter and make maps from existing photography. a Nascent Public Lab Cartography Collective.
My attempt and results
We started a process document here. We have a number of New Orleans Locations where we can meet over computers.
We are meeting and communicating over the Gulf Coast and Public Lab and Grassroots mappers lists, so sign up!
The first two sets of photos we have to work with are for Bayou St John, and Bayou Bienvenue Shoreline.
Download them from google drive here
Soon, we will discuss GroundworkNOLA's photos of MacMain's schoolyard.
Scott will make a wiki page for all of the photography that is unmapped for the Gulf Coast here:
Questions and next steps
Wanna join? want to skype in? Scott will work on adding that capability. Scott is eustatic0 on Skype.
Contact Alex Stoicof on the gulf coast or barnraisers lists, and Alex or Scott can send you a Doodle Poll.
Follow related tags:
gulf-coast balloon-mapping kite-mapping mapknitter

Balloon Mapping of Bienvenue Wetland Triangle Bulrush Planting
What
Acting quickly in repsonse to a windfall of freshwater marsh plants, inspired staff of Coalition to Restore Coastal Louisiana, Sierra Club, Lower 9 CESD, Common Ground Relief: Wetlands, GroundworkNOLA, and Gulf Restoration Network planted accessible areas of the Bayou Bienvenue Wetlands Triangle by the Caffin Ave Platform. The planting strip is a linear feature off a recent road placed to maintain the steel I-wall that is part of the Orleans parish levee system.
This marks one of the first times that the Wetland Triangle has been planted with salt tolerant, but freshwater plants. The Wetland Triangle is historically freshwater Cypress Swamp, but saltwater impoundment, deep water, and saline soils have hampered restoration plantings in the past.
[ i'll put some of the facebook discussion up here]
My attempt and results
Given the low winds predicted for the day, Scott Eustis (well, me) prepared a balloon for mapping of the abruptly planned planting event. the publiclab 9 ft delta kite was available in case of a change in wind.
weather was sunny, wind 0-5 from the north. dust flew from the southern scrap pile early in the day.
focus on the camera, Canon 1400 powershot, was descent. the rig was a squared juice bottle with UV proof rubber bands.
the balloon was re-used, with some of the same helium from months before, from the nature center flight. a leak in the balloon near the neck of the balloon was patched with black gaffer's tape, reinforced with cheap duct tape.
canoe was piloted out from the ROW to compensate for the wind, to safeguard against the string hitting powerlines. as the wind dropped, the balloon tracked too far north, and the canoe was piloted back toward the ROW, but there may be gaps in the map of the planting.
Questions and next steps
mapknitter work forthcoming.
selected images at https://www.flickr.com/photos/eustatic/sets/72157636993772393/
image showing volunteer bulrush clump at western end of I-wall / planting area:
Follow related tags:
balloon-mapping annotated-maps bayou-bienvenue bienvenue