The Public Lab Blog
stories from the Public Lab community
About the blog | Research | Methods

Public Lab Community Newsletter August 18, 2013
This newsletter includes some notes on the growth of PublicLab.org with some stats on the visitors to the site. Lots of great research related to outdoor August activities getting posted online. We got your hornworms and goat brush control covered in the action from this last week.
Announcements
Note on Public Lab community growth on the web: http://publiclab.org/notes/warren/08-13-2013/public-lab-community-growth-dec-2010-aug-2013
Upcoming Events
Boston-area event at Tidmarsh Farms, more info coming soon at https://www.eventbrite.com/event/7883512799 - Tidmarsh Farms is a 577 acre cranberry bog of which 250 acres are currently undergoing restoration to natural wetland. IR balloon mapping will help researchers from UMass Boston and the Massachusetts Division of Ecological Restoration identify natural peat springs that will inform the design of new stream channels to produce a self-sustaining wetland ecosystem.
The Open Hardware Summit is coming to MIT on September 6th. User gbathree put up a research note about preparing for the event: http://publiclab.org/notes/gbathree/08-13-2013/photosynq-preparing-for-the-open-hardware-summit
New and ongoing projects with Public Lab tools
Infragram.org expands client-side image processing to include a new simple mathematical language for compositing images: http://publiclab.org/notes/warren/08-17-2013/infragrammar-compositing-infrared-images-with-simple-mathematic-expressions
Some great imagery on goat-powered brush control for fire prevention: http://publiclab.org/notes/patcoyle/08-16-2013/visible-and-infragram-maps-of-goat-brush-control-along-arroyo-mocho-creek-livermore-ca
Expanding the spectra archive at spectralworbench.org with import from NIST and WebMineral: http://publiclab.org/notes/warren/08-13-2013/importing-spectra-from-nist-and-webmineral-com-to-spectral-workbench
The Trapa Natans invasive species mapping continues with these notes on detecting and classifying the map data: http://publiclab.org/notes/ttaylor/08-16-2013/a-little-background-work-for-trapa-classification-from-color http://publiclab.org/notes/ttaylor/08-18-2013/using-image-texture-to-find-trapa
Hornworms! An interesting tale on imaging unwanted caterpillars in the garden. Potentially startling animated GIF included: http://publiclab.org/notes/cfastie/08-18-2013/hornworms
Research Notes Highlights
A new wood and metal DIY picuvet design: http://publiclab.org/notes/TedF/08-18-2013/constructing-a-2-90g-wooden-metal-picavet
Notes from building a larger kite camera housing for a video camera: http://publiclab.org/notes/jmgianca/08-15-2013/sled-kite-video-rig
Trying out smartphone wind meter apps and accessories: http://publiclab.org/notes/patcoyle/08-18-2013/windmeter-options-for-iphone-shaka-and-wind-meter
White balancing a Canon camera for Infragram photography: http://publiclab.org/notes/warren/08-15-2013/white-balancing-a-canon-camera-for-infragram-photography
Public Lab in the media this week
http://www.critigen.com/blog/balloon-mapping-summer-fun Over 3000 visitors from http://www.heise.de/tr/artikel/Kartographieren-per-Ballon-1930114.html From late July, only for UK viewers: http://gadgetshow.channel5.com/gadget-show/blog/episode-3-aerial-photography
Follow related tags:
newsletter blog response:8936 response:8992

Public Lab Community Newsletter August 11, 2013
Fall 2013 Barnraising
We are happy to announce that this year's Barnraising theme is Education! You are invited to join the Public Lab community in person as we gather October 4-6 for the third annual Barnraising in Cocodrie, Louisiana.
 Shown above: Gulf research station LUMCON hosts the Barnraising. In the background, a Barnstar.
What is a Public Lab barn raising, you ask? This is the closest thing we have to a Public Lab conference -- but with an emphasis on "doing stuff together" rather than just presenting/talking. In the spirit of bringing a community together to collectively raise a structure such as a barn, Public Lab comes together to develop tools, toolkits, supporting materials such as guides and tutorials, test the tools and develop new research directions and projects. Participants represent a wide range of interests from technologists and designers to social scientists and community organizers. Find more information here: http://publiclab.org/wiki/barnraising-2013, including a fantastic video of our 2012 Barnraising. Getting started: Join the discussion on the Barn Raising mailing list: https://groups.google.com/group/plots-barnraising. We are exploring the dimensions of the Education theme, what sessions will be important to include, and who wants to present which sessions. There is no charge to attend the conference, please note the cost of lodging at LUMCON is $20/night. RSVP here. (direct link: https://docs.google.com/forms/d/1FmmZFUUn2fOe-xI9-gtWdge8C-nXCTS9G0D977YOwAE/viewform) Oh, and did I mention we go boating and kite flying every afternoon? ;) We aim to make this event accessible to new members and familiar voices alike, please let us know if we can answer any further questions or help you plan for your trip.
Announcements
Edmund Scientifics should soon be carrying our DIY spectrometer kits! Details soon.
Infragram filter packs are nearing readiness for us to start shipping them; preorder one now: http://store.publiclab.org/products/infragram-diy-filter-pack
Upcoming Events
The Gowanus Canal Conservancy, Public Lab, and GLAM are having a stitching Party at 61 Local in Brooklyn, on Monday August 12 at 7:00pm.
Public Lab will be at Maker Faire NYC in September; stay tuned for details and get in touch (organizers@publiclab.org) if you’d like to help run our booth, or just say hi!
New and ongoing projects with Public Lab tools
Infragram.org website is open for business! Still has some rough edges but it looks great and processes larger images now: Infragram.org
Several Public Lab organizers have been working with NASA Develop to investigate oil refinery emissions by taking spectra of stack flares with the Public Lab Spectrometer. This is a challenging task which will require more experimentation to learn how to point the spectrometer at a distant flame, capture spectra from a faint source, and separate the background glow from the spectral emission peaks of sulfur, nitrogen compounds, and organic carbons.
Chris Fastie has posted two more notes about the July 22 WATERCHESTNUT event in Amherst, MA. These describe continued efforts to use the multispectral aerial photos to identify the invasive aquatic Waterchestnut (Trapa natans). All WATERCHESTNUT notes can be seen here. Chris would also like to scold Dan and Jake, the organizer and host of WATERCHESTNUT, for not yet posting any research notes from the event as they promised to do! Also, did anyone get any photos of the big purple balloon being flown from the canoe? Please share!
Jeff Warren has continued the search for small cameras that can become the Infragram Kickstarter reward cameras. Most inexpensive webcams have CMOS sensors with a particular type of Bayer filter that allow near infrared light to contaminate the blue channel, which must be rather pure visible light to make good Infragram photos. Some small CMOS cameras do not have this problem, so Jeff is confident that he will find some good candidates soon.
Research Notes Highlights
Spectrometer building: A nice custom version of the Public Lab spectrometer. This spectrometer has produced one of the most detailed fluorescent lamp spectra at Spectral Workbench. Martin has built a nice custom version of the Public Lab spectrometer. This spectrometer has produced one of the most detailed fluorescent lamp spectra at Spectral Workbench and a successful positive test for a water filter.
Spectral Workbench: Sreyanth’s second note about his new code which finds similar spectra at Spectral Workbench. Sreyanth is one of three Google Summer of Code students working on Public Lab coding this summer.
Tar Balls and Green Lasers: Zapping Grand Isle Coffee: Team Orca and the green laser
Analyzing Coffee with a Public Lab spectrometer: Brainstorming "coffee analytics" system for coffee shops
Mobile Spectrometer Development: 3D model now on Shapeways [Update on the final molds])(http://publiclab.org/notes/warren/08-07-2013/smartphone-spectrometer-molds-being-machined)
Landsat Satellite Imagery: Guide on how to determine when the Landsat 8 satellite is scheduled to pass over your area of interest
KAP flights in Canada: Saskatchewan Alberta
Kite Festival in Berkeley California: Aerial Oblique Panorama
Can the Public Lab spectrometer be used to distinguish different types of ancient mortar in the ruins of Pompeii?.
Follow related tags:
newsletter blog response:8936 newsletter-archive
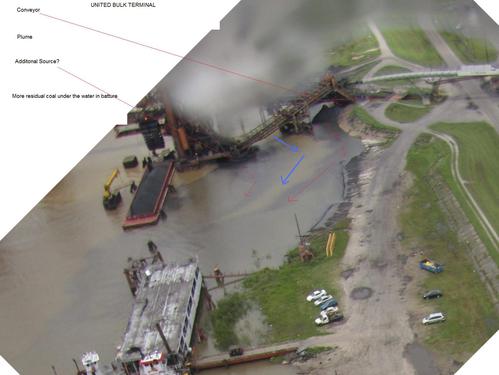
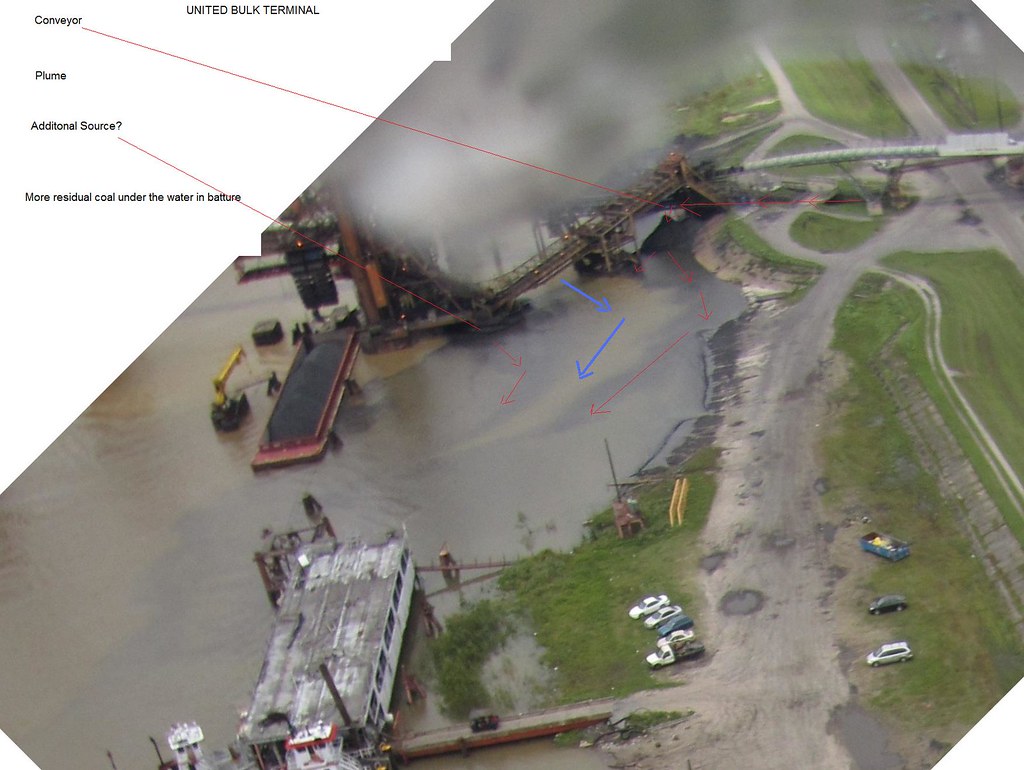
Kite Photo of Ongoing Coal Pollution in Plaquemines Parish, LA
Kite Photo of Pollution from United Bulk terminal
We gained a new perspective on the ongoing pollution from the United Bulk terminal using a "Little Bear" Delta kite.
link https://farm8.staticflickr.com/7284/8742168630_279f662a1f_o.jpg
Quick Success
It was a sunny, windy day with uncommonly steady, strong wind at the sweet spot of 15 miles per hour.
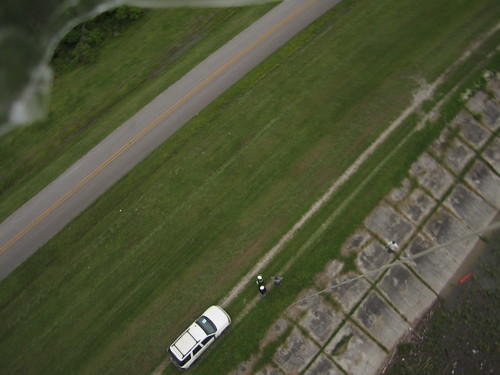
We walked the levee and put the kite up. On account of the excellent conditions, the kite "sank" into the air like an anchor, actually much steadier than any balloon I've ever flown. This is also a testament to the quality of the kite model, I think, which is made to lift laundry.
the picture below was taken within two minutes. All pictures were taken in ten minutes, and the camera put away before the sheriff arrived.
It's important to note that
- we didn't drive on the levee, as per parish ordinance. this becomes more of an issue as high water season has arrived, and levee inspections occur daily.
- it is perfectly legal to stand on public property and take pictures of pollution. It is important to know property boundaries and assert them if plant managers accuse you of trespass.
- there are no Homeland Security regulations concerning photography of oil or coal facilities, despite what the plant manager will tell you. (it's different for nuclear facilities and military bases specifically barred from photography by local military authorities)
- the Sheriff has discretion to arrest anyone deemed a threat. In this situation, the plant manager reported that we were "suspicious," but also that we "look[ed] like normal guys". Our names were run through the FBI system.
- you might not have such luck with the Sheriff if you don't 'look like a normal guy.'
- I was glad to have Devin there to talk to the workers and manager while I flew the kite.
Later, an NRC report was filed. http://www.nrc.uscg.mil/reports/rwservlet?standard_web+inc_seq=1045328
Future Modifications
in the future, I plan on modifying the soda bottle rig to capture obliques. I find that the breen box / picavet is commonly too heavy for Gulf Coast's irregular winds.
Below is the re-post from Healthygulf.org
 A few fridays ago, I and Devin Martin of Sierra Club Delta Chapter walked the river to find coal and pet coke washing into the batture.
On previous trips we had seen both mineral coal and slimy coal tar downstream of United Bulk, and watched as a river otter fed on blue crab in the anchorage of an array of barges.
We walked the levee along the blackened river and flew a kite to gain perspective on the source of the discharges lazily spewing from a coal conveyor. Click here to see how United Bulk is polluting the river with Coal and Petroleum Coke.
Although a mystery to us from google earth photography,which has been wonderful at documenting the long-negligent practices of the terminal, the little pile of petroleum coke building up in the batture of the flooded riverbank was apparent from the kite photos.
Our public watchdogs shouldn't stand for this. Although we live in an area saturated with chemical plants, Petroleum Coke should still be considered a pollutant significant enough for the attention of the Coast Guard. United Bulk is not allowed to just let their waste into our river. When cleaning up the pile would only require simple mechanical fixes--like a cover on the conveyor belt, companies like United Bulk can easily do more to keep it clean.
Sadly, it's up to us, the citizens ourselves, that must enforce the environmental laws. As of press time, we still haven't heard from DEQ on what is happening at this conveyor, and why it's so dirty.
Although the plant manager doesn't like it, it's unquestionably legal to stand on public property and take photos of United Bulk's pollution.
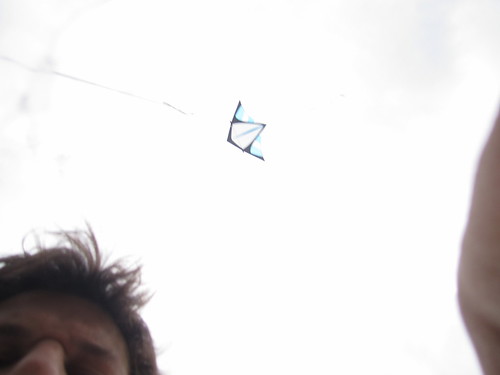
A photo of the kite used to catch United Bulk in the act.
tarry substance in the batture at United Bulk
Scott Eustis, M.S. is GRN's Coastal Wetland Specialist
Follow related tags:
gulf-coast kite-mapping watchdog water-quality

Tool for Stalling: Mapping
If the official world of maps has mutated into an insane apparatus of surveillance and control, why should communities use maps to make land tenure claims?
Maps historically have been used as instruments of the state. Through counter-mapping, communities can appeal to the state's values. By doing so, they hijack cartography to make themselves visible and more difficult to dismiss.
Using these principles, The Craft Market in Nsambya (pseudo name to protect the community) and I collaborated to build a map that would serve to stall eviction by the state. The end goal was to gain time so the community could organize their next steps, while creating a dialogue around urban planning and the displacement of communities in the developing context.
/////////////////////////////////////////////////////////////////////////
Geographic Information Systems (GIS) display geographical data in a manner which allows people to trace patterns and reveal trends. With the advent of Digital Media, search-engine-based GIS like Google Maps have proliferated for its ability to pinpoint commercial establishments and its user-friendly interface.
"Google Maps offers live, shifting representations of a complex interplay between utility and constantly changing contexts, content and commercial ambitions in one of the world's fastest growing, most lucrative markets. More than a map, it is a kind of 'macroscope'; a tool set that makes sense of a system we are using on the outside while changing from within"(Schulze).
I personally have multiple critiques regarding the Google Maps platform and the way it shapes a person's experience in a space, but my biggest concern is what information is being displayed, not how the information is accessed.
Google Maps oozes an aura of authenticity and credibility that makes it hard to question the information it displays. Partly because the photographic elements seem to be miniature pieces of reality anyone can make (Sontag) and partly because of the companies' emphasis on data collection.
Information is shaped by the company's intended commercial goal. Google's mission is to organize the world's information and make it universally accessible. In "Ten things we know to be true" they acknowledge this is to be a monumental task. They state that researchers at Google continue looking into ways of providing all the world's information to people seeking answers; they are working hard to consistently incorporate information that was not readily accessible before. But when your core interests are companies, what information becomes important and how does it get prioritized?
Google's position is that they are a business first. Their revenue comes from the sale of highly targeted text ads displayed along the searched query. Another source of revenue is offering their enterprise solutions (Google Apps, Google Earth & Maps, and the Google Search Appliance) to companies and to different government agencies around the world.

Google's image of The Craft Market. It is not tagged.
If Google thrives to make information accessible and Google Maps is a kind of 'macroscope' that helps consult places in a space, then what happens to the places and people that are not business? How can mapping be free from the tyranny of the state and from big corporations to bring visibility to small business and communities that do not fall in line with the macro scale?
This is where counter-mapping in the form of Indigenous Mapping and "Community Satellites" come in.
Indigenous Mapping allows a community to ensure that their geographic qualities and boundaries are visible, especially in disputes of land tenure by engaging the community in the map-making process.
Bernard Nietschmann, an advocate of Indigenous Mapping, in the text "Defending the Miskito Reefs with Maps and GPS: Mapping With Sail, Scuba, and Satellite" suggests that Indigenous Mapping "...helps authenticate traditional territory, calls into questions a central government's assertion that indigenous people don't have a land or a sea territory, and serves internationally to promote greater self-determination" (Nietschmann). They help to apply social force to the government against disputes over land tenure.

The Craft Market's hand-drawn map
When I met The Craft Market in October 2012, they had already decided that mapping was the best tool to make claims on their space and document other areas already evicted in Nsambya. Using their expertise, they created hand drawn maps of the Craft Market and surrounding areas. But even though their hand drawn map was geographically correct and documented their placement, it failed to document the 800-person workforce in the market. Similarly, Google Map's satellite image of the area did show the market, but there were only images captured when it was empty. In addition, it was not tagged as The Craft Market.
This is when appealing to the state's values by using photographic evidence became key. By amplifying the resolution of their map we could question both the state claims on The Craft Market's importance while subverting the Google Maps representation of the space. Groups like Grassroots Mapping (The Public Laboratory) have set out to develop open-source tools like the 'community satellite' that invert the traditional power structure of cartography.

PLOT's (formerly Grassroots Mapping) balloon mapping kit
'Community satellites' are built by combining helium balloons, household items and inexpensive digital cameras in order to achieve high-resolution aerial photography. By lowering the access cost of aerial photography, 'community satellites' can be used by communities question the subjective nature of mapping as a medium of state control.
Using their kit, The Craft Market and I set out to amplify the resolution of their map to make their claims more sound. The goal was to combine the bird's-eye view of aerial mapping with the bottom-up approach of community stories to enable multiple narratives of place to be visible and relevant.

Resulting photographic map with the middle stalls.
Users of Google Maps are not able to actively shape the maps displayed. Instead, we release the photographic map to the public domain through an open-source GIS, OpenStreetMaps. Google Maps sometimes takes information from OpenStreetMaps of areas they are not able to constantly update. This way The Craft Market and I were hoping to affect Google Maps while shaping their online presence in a method that was relevant to them.

The Craft Market in OpenStreetMap
The Craft Market's agency and the aerial mapping managed to stall the eviction through different structures. It stalled the eviction legally for a month when the community, using the map, acquire a court injunction. Also, they sent letters to several different government agencies. The map proved to the Ministry of Tourism that they played an important role in the tourism industry. The Ministry of Tourism sent a team to evaluate their work and wrote a letter to the Ministry of Land pleading their case. This stalled the eviction, bureaucratically, for two extra weeks.

Ministry of Tourism's letter.
In the end, the community was evicted on February 25, 2013. We decided to do a second map in hopes of recording the progress of the clearing. We also wanted to document how the lack of support during the eviction had displaced the previously flourishing market to a side street and create a stark contrast between the before-and-after. Using this new map, The Craft Market wanted to advocate their case and get support to relocate to a better location.

Map displaying the before-and-after.
Layers
After revising this tool for stalling, I realized that while useful to make counter arguments, it failed to recognize the community's collaboration or expertise. By being a polished and finished photographic map, it used a representational value that the state can acknowledge, but left no space to present their own hand drawn map or a systematic investigation.

Different resolutions of The Craft Market
This image is a personal exercise of me as an outsider creating the graphic and is not a graphic created collaboratively. The layered image is a first attempt at incorporating their contribution in the graphic-map aspect of the research.
Corporate Level: The first layer is the Google maps image and represents the market with only the aluminum stalls. Google, as a foreign global institution, is shaping our perception of the actual size and impact of the market. Google is making claims on the geographic boundaries of the space by naming buildings and marking roads. The ideas behind the credibility of photographic representations and the prestige of the institution render this map as the most important source to what was physically in the space.
Community Level: The second layer is the hand drawn map done by the community. By being the experts on the ground, they mark on the map what was relevant to them.
Collaborative Counter State Level: Through a workshop of balloon mapping, The Craft Market and I amplified the resolution of their hand-drawn map to level the playing field.
Counter-Corporate Level: Feeding the map back into an open source GIS, the community was able to shape the way they were being represented and made their own boundary claims online.
Erasure Level: Stripping the land suggests the presence of the new owner and the new owner's workers who are making preparations for a new phase in that space. Dismantling the stalls behind hidden tall metal fences hints to the erasure of the previous occupants. Nothing is left of their presence, their memories, or of how they had impacted that space.
For more information on the project Tools for Stalling and The Craft Market feel free to visit http://www.cargocollective.com/mlamadrid
This piece is republished from http://cargocollective.com/mlamadrid/Tools-for-Stalling-Mapping
Thanks and hope you enjoyed!
Follow related tags:
balloon-mapping uganda eviction tenure

Why Collaborative Development Works in a Proprietary World
This was re-posted from PBS's IdeaLab blog
Public Laboratory is made up of a diverse group of contributors, some working from their homes or garages, some from their workplaces or even university labs. What brings us together is the idea that open-source, collaborative development can result in inexpensive and accessible environmental sensing.
But to many, the way our community operates can be disorienting. We've approached these unique challenges in several ways.
Most people are familiar with collaborative development of textual works, such as co-authorship, or even mass co-authorship in projects such as Wikipedia. Software development is textual as well, and such communities are made possible by carefully tailored open-source licenses, which effectively stop any individual or organization from controlling the whole project.
By contributing to these works -- say, an open-source web browser or an article on gumdrops -- authors are assured attribution but cannot stop others from building upon their work, improving or adapting it for new uses. This works in part because each time programmers or Wikipedians contribute, their name is explicitly entered in a registry of sorts. By publishing their contributions, they give up a certain amount of control -- of course, they'd almost certainly built upon the prior contributions of others who made the same choice.
Now imagine applying that system to non-textual works, such as a new kind of camera or a tool for detecting air pollution. The way Public Laboratory works, these designs are developed, tested and improved slowly through dozens of meet-ups, workshops, field events, and brainstorming sessions. At each meeting, participants agree to share their contributions in an open-source manner -- but there is typically no explicit record of every contribution.
To compound this, journalists (not to mention partners and even funders) prefer hierarchical organizations so they can say things like "developed at MIT," and they really love citing individuals, not nebulous groups of "contributors." We've often had to insist on group attribution in the media, and developing a so-called "attribution infrastructure" is a major focus on our website.
Design for attribution
We recently launched a small set of new features on our website, PublicLaboratory.org, to address these challenges. While many people make use of our tools, as a community we'd like to highlight those who contribute improvements and share their knowledge with others. With that in mind, we've come up with some ways to track when Public Laboratory contributors actually post about their work on the PLOTS website.

Taking a cue from socially oriented open-source website Github.com, we've posted small graphs of the amount of activity on a given project over the past year. A quick look at these graphs shows how much activity they've seen in recent weeks, and gives visitors a sense of how dynamic a research community is involved in a particular project.
 This box is shown on every Public Laboratory tool page or place page.
Above that graph, we've listed contributors and the number of posts they've made (which are tagged with the tool, i.e. "thermal-photography". The intent here is not to make things competitive (though that wouldn't necessarily be a bad thing) but to give people a sense of satisfaction that they've been a part of a communal effort, and a glimpse (to outsiders) of the number of people who have made the project happen.
By placing emphasis on the posting of content, we hope to highlight attribution for those who do good documentation and share it in a public venue -- though anyone is welcome to use, adapt, repurpose, and improve upon Public Laboratory projects.
In order to be an active participant in our grassroots research efforts, you've got to reach out to others and share your work. This may not be natural for many people; contributors from many backgrounds are often accustomed to sole authorship credit, while others wonder who will care whether they publish or not. In a collaborative effort such as ours, however, success is gauged by how many others are able to leverage your work and reproduce or improve upon a set of tools you have contributed to. In an open-source context, seeing someone else replicate or adapt your work is a gratifying affirmation that your documentation and development work have resulted in legibility and accessibility for a potential collaborator, not an instance of plagiarism or infringement.
 A network graph for the OpenStreetMap project shows the complex web of distributed contributions to a typical open-source project.
ShareAlike and Free Hardware
"Open source" means different things to different people, and with the above challenges in mind, it's important to make some distinctions. Strictly speaking, open source just means that you publish the source files of your work -- and in the case of hardware, the associated design files. A good open-source project will provide legible documentation and support for others who wish to read and understand those files. If you've heard of "free software" (we'll invoke the refrain "free as in freedom, not as in beer" here), you might be familiar with its more stringent requirement that users have the right to "run, copy, distribute, study, change and improve" the software. This is the basis of our approach to open source, public, civic science -- and it underlies our community's aversion to proprietary non-free (in both senses of the word) software such as Photoshop or Google Earth.
The noted lack of such freedoms in the area of scientific equipment and instrumentation -- and the barriers that creates for a more legible and participatory approach to science -- is a major motivation for our work.
Finally (for now) there is the idea of requiring anyone who takes advantage of these freedoms (by downloading, adapting, modifying and improving) to share their work in turn, under the same license. This requirement, known variously as a "sharealike" or "copyleft" clause, can be controversial, as it explicitly requires people (and companies) to become producers, and not just users, of open-source works. With some exceptions for datasets and privacy considerations, we have adopted sharealike licenses across all Public Laboratory content, and are in the process of releasing even our hardware designs under a sharealike license, the CERN Open Hardware License.
While these ideas may be unfamiliar for many, they make it possible for diverse communities such as ours to develop complex technical systems in a way which attributes and protects contributors' work, and ensures that these shared efforts remain public, accountable, and open to newcomers. They allow anyone to use PLOTS tools and techniques without needing to seek permission, while encouraging newcomers to contribute just as they benefit. They offer a public and grassroots alternative to closed, expensive, and proprietary systems of technology production which have resulted in a science that serves powerful and wealthy corporations above local communities and the underprivileged.
Such considerations are an important part of the PLOTS approach to building participatory environmental science collaborations. Ideally, our community's works will inspire readers or viewers to apply civic science ideas to their own lives -- adapting tools to local issues -- and with luck, they will become active participants in our research community by sharing their work publicly. In time, some may go on to organize local civic science groups, further the development of PLOTS' open-source tools, innovate new technologies or approaches to environmental monitoring, and challenge and refigure the very structure of participation.
Follow related tags:
collaboration licensing idealab blog