Detecting wastewater pollution
Lead image: Along the Suquía River in Córdoba, Argentina. From this comment by @alejobonifacio, CC BY SA
Wastewater is “used water” that’s created by households, cities, and industry. It ranges from sewage to surface runoff that can flow from roadways into storm drains. Untreated or under-treated wastewater can contain a variety of pollutants that can harm people and ecosystems when it’s released into the environment.
On this page, we’re collecting information on some of the clues that might indicate wastewater pollution in the environment, and ways to investigate them. Some methods assess general water quality conditions that can correlate with wastewater pollution, while other methods can more directly signal the presence of wastewater by identifying specific pollutants.
Detecting possible wastewater pollution
There’s lots of information (in English and Spanish) about what to look for in the comments of this question: What are some observable tell-tale signs of wastewater pollution?
If you’ve tried any of the approaches below to detect or document wastewater, please share your experiences and post a research note! Also help to improve this wiki page by editing it!
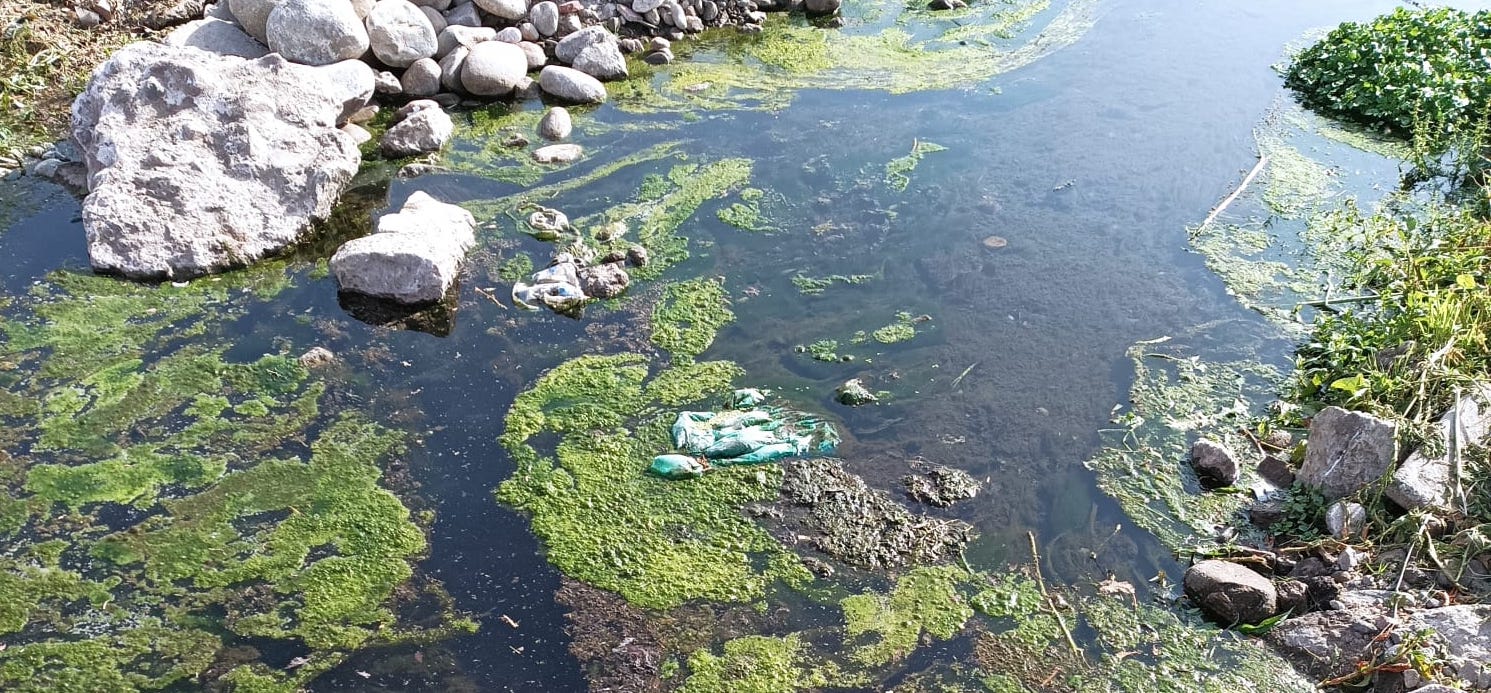
Change in water color or clarity
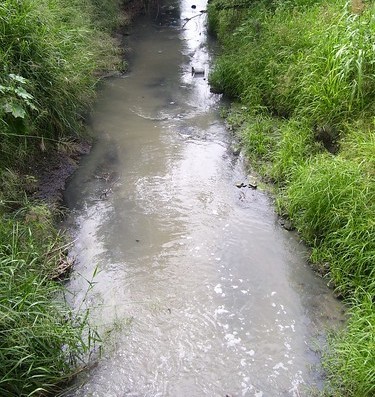
Cloudy looking stream water, Sustainable Sanitation Alliance, CC BY
METHODS:
Documenting visual changes in water color or clarity

Post your photos of possible wastewater pollution! / ¡Postea tus fotos de aguas posiblemente residuales! 📷
Post by @bhamster 2 | over 3 years ago

- Aerial photography and satellite imagery
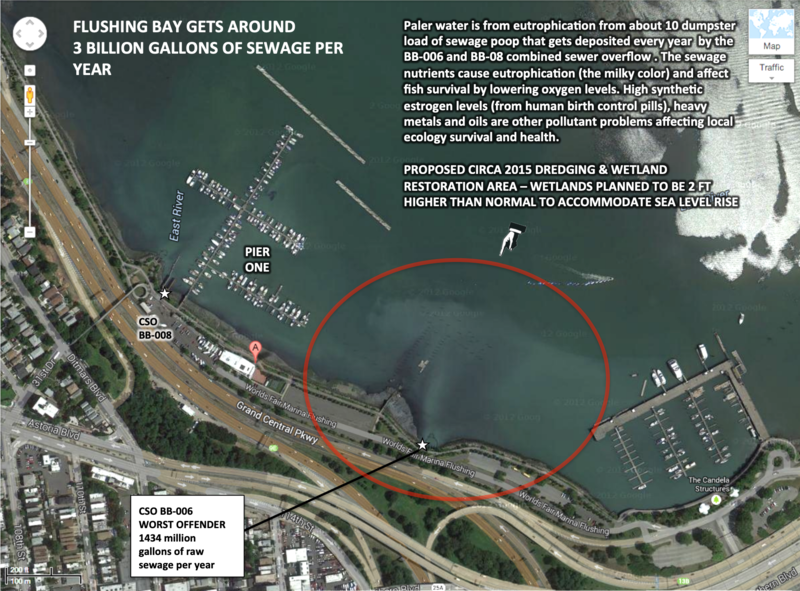
Satellite image showing discolored, cloudy water in the Gowanus Canal. From this slideshow by @eymund.
Documenting changes in water color/clarity with spectral imagery (might not be visible to human eyes)
- Infrared balloon image reveals Gowanus plume, and note this comment that the plume is likely flowing sewage sludge that shows up in the near-infrared range because of the bacteria and small algae in the sludge.
- Multispectral analysis of satellite images: like in the paper, “Tracking stormwater discharge plumes and water quality of the Tijuana River with multispectral aerial imagery,” by Svejkovsky et al. 2010.

Visible and near-infrared photos composited to reveal a plume of flowing sewage scum, originally from this note by @liz.
Measuring turbidity of water
Solid particles floating throughout the water (called suspended solids) increase its turbidity. Learn more about turbidity in this research note from @anngneal.
- The turbidity wiki page has a list of sensors and other tools that enable physically measuring turbidity
- Question: How do I choose a method for monitoring turbidity?

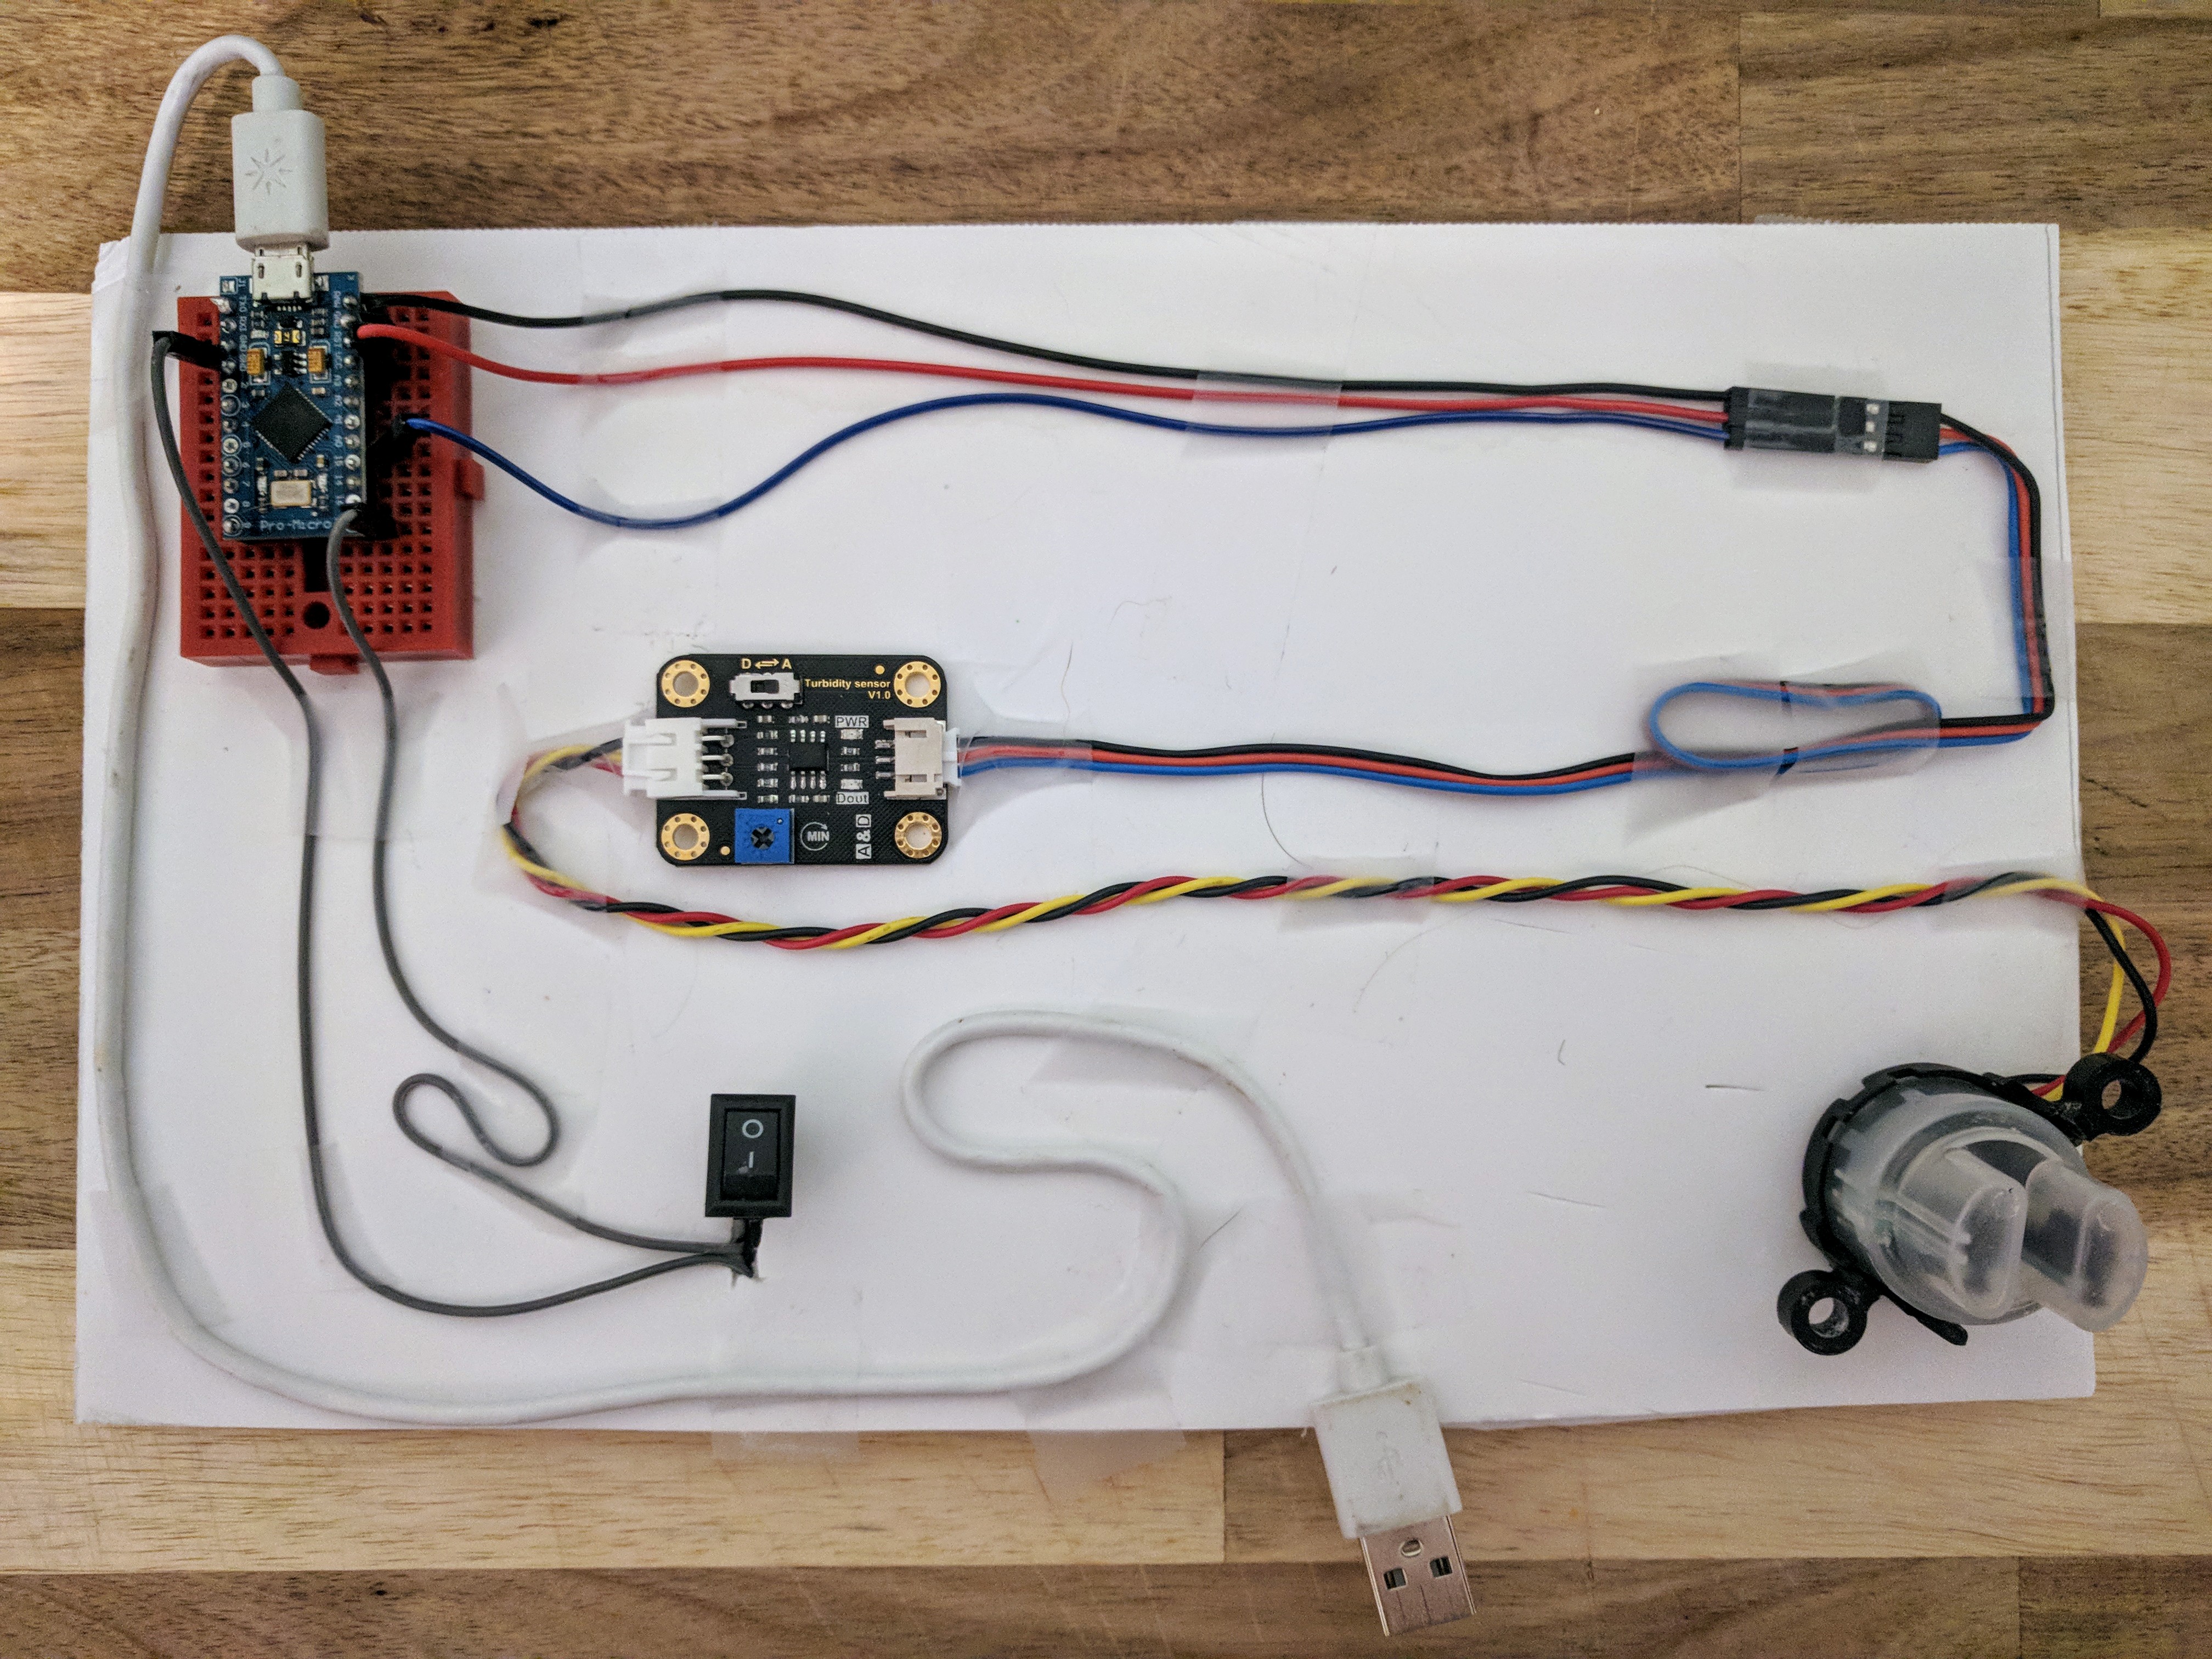
Left: Secchi disk for measuring turbidity, from this note by @anngneal. Right: Simple turbidity sensor prototype, from this note by wmacfarl.
Activities on turbidity
| Purpose | Category | Status | Author | Time | Difficulty | Replications |
|---|---|---|---|---|---|---|
| Turbidity sensor prototype | - | - | @donblair | - | - | 0 replications: Try it » |
| Photometer Kit idea | - | - | @programmer1200 | - | - | 0 replications: Try it » |
| Turbidity Sensor | - | - | @bhickman | - | - | 0 replications: Try it » |
| Photo Documentation of Turbid Waters for Advocacy | - | - | @gretchengehrke | - | - | 0 replications: Try it » |
| Willow Creek Water Quality Monitoring (EC and TDS) | - | - | @MadTinker | - | - | 0 replications: Try it » |
| Water Quality Testing At Turkey Creek | - | - | @Delaney | - | - | 0 replications: Try it » |
Activities should include a materials list, costs and a step-by-step guide to construction with photos. Learn what makes a good activity here.
Odor
See this comment from @jesseslone about odors near wastewater discharge areas and what they might indicate.
METHODS
Methods and activities related to odor logging can be found here: https://publiclab.org/methods#odor
Activities on odor
| Purpose | Category | Status | Author | Time | Difficulty | Replications |
|---|---|---|---|---|---|---|
| Community-level Odor Mapping Site | - | - | @sarasage | - | - | 0 replications: Try it » |
| Citizen log v1 | - | - | @imvec | - | - | 0 replications: Try it » |
| Odor Log 1.0 | - | - | @imvec | - | - | 0 replications: Try it » |
| Online Odor Log v1.0 | - | - | @imvec | - | - | 0 replications: Try it » |
| Smells that Kill: How to Identify Odours | - | - | @kgradow1 | - | - | 0 replications: Try it » |
| How to Keep a Pollution Log | - | - | @kgradow1 | - | - | 0 replications: Try it » |
Activities should include a materials list, costs and a step-by-step guide to construction with photos. Learn what makes a good activity here.
Changes in water temperature
METHODS
Thermal fishing bob
Sense changes in water temperature and display temperature differences with colored lights in the field. Take a long-exposure photograph to record the results!
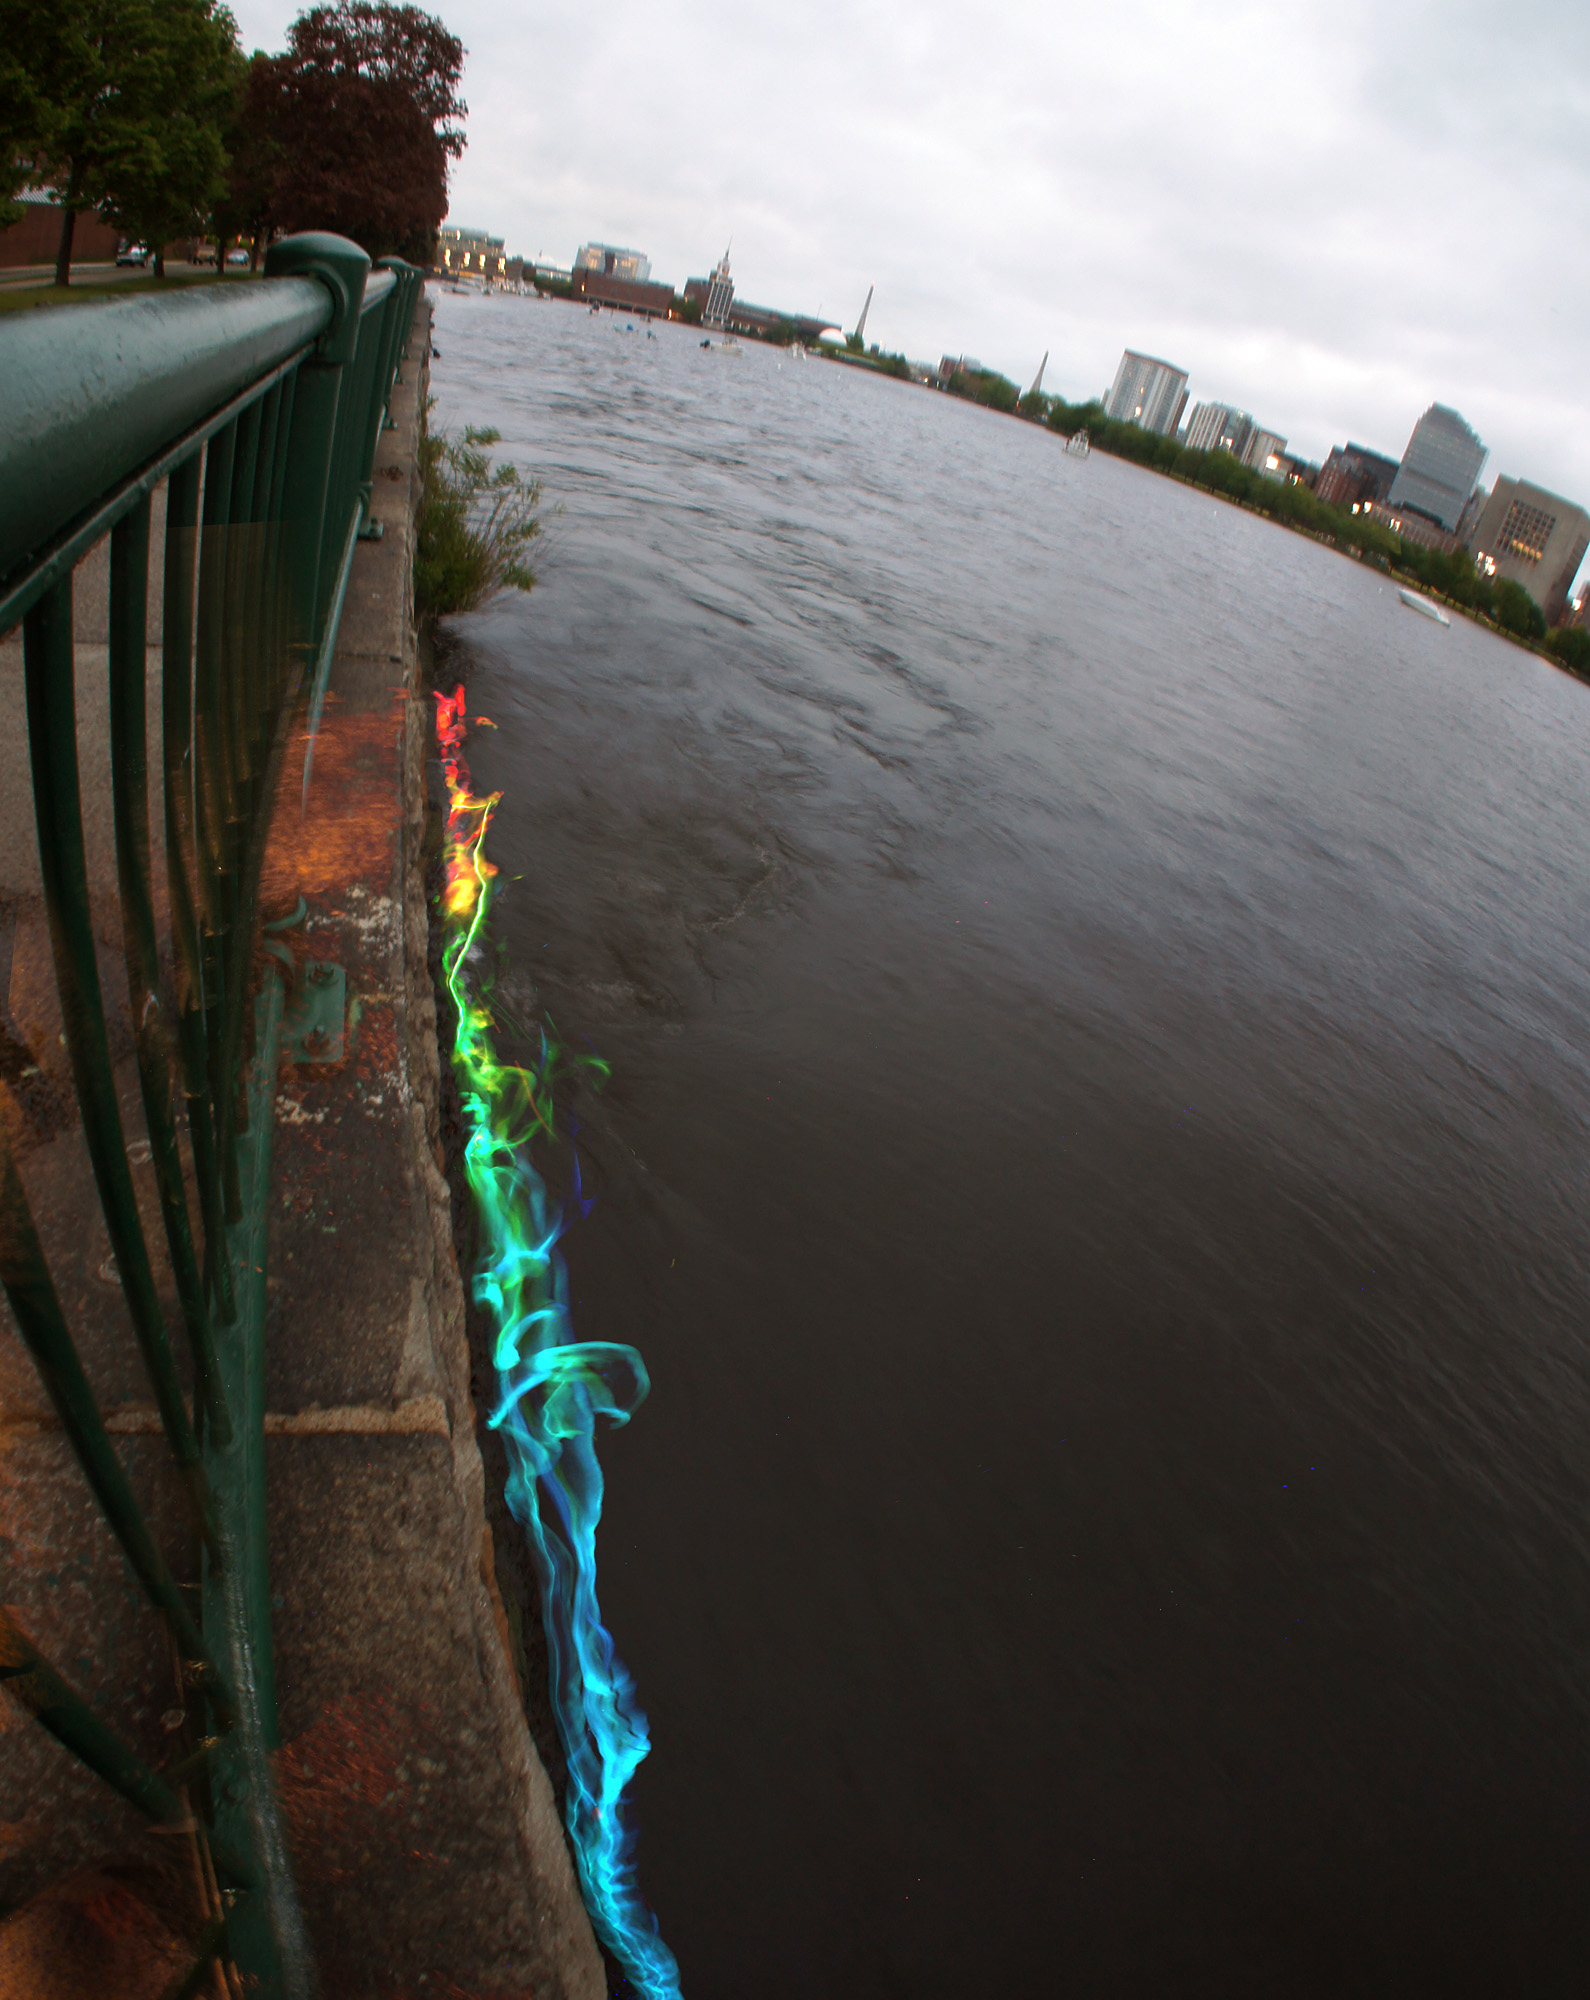
A long-exposure photograph of colored lights on a thermal fishing bob towed in the Charles River, Boston. The different colors indicate differences in water temperature near a power plant, which releases heated wastewater into the river. From this note by @Sara.
- About the thermal fishing bob and how to make one: https://publiclab.org/wiki/thermal-fishing-bob
- Successful Thermal Fishing Bob Test: Mapping the Kendall Power Plant Thermal Plume
Activities on thermal-fishing-bob
| Purpose | Category | Status | Author | Time | Difficulty | Replications |
|---|---|---|---|---|---|---|
| Thermal Fishing Bob: multiple inputs/outputs | - | - | @lperovich | - | - | 0 replications: Try it » |
| GO SCUM update | - | - | @liz | - | - | 12 replications: Try it » |
Activities should include a materials list, costs and a step-by-step guide to construction with photos. Learn what makes a good activity here.
Thermal photography
- https://publiclab.org/wiki/thermal-photography
- Detecting warmer water at wastewater outfalls with thermal photographs, as noted on pg. 27 of this guide for municipalities detecting illicit discharges of wastewater
Activities on thermal-photography
| Purpose | Category | Status | Author | Time | Difficulty | Replications |
|---|---|---|---|---|---|---|
| Kite Aerial Remote Sensing (KARS) - Thermal Infra-Red. | - | - | @John_Wells | - | - | 0 replications: Try it » |
| Analyzing Thacher Insulation: an Aerial Thermal Mapping Project | - | - | @NIKIBOPOLOUS | - | - | 0 replications: Try it » |
| Rent FLIR thermal infrared cameras at some Home Depots | - | - | @warren | - | - | 0 replications: Try it » |
Activities should include a materials list, costs and a step-by-step guide to construction with photos. Learn what makes a good activity here.
Conductivity
For example, salty wastewater (brine) associated with fracking can cause a spike in water conductivity (source: FracTracker).
Organic pollutants like oil, however, don’t generally conduct electricity well and may lower the conductivity of water.
“A failing sewage system would raise the conductivity because of the presence of chloride, phosphate, and nitrate; an oil spill would lower the conductivity.” - US EPA
METHODS
https://publiclab.org/methods#conductivity
Two examples:
- Coqui audible water conductivity sensor
- Riffle open source water monitor, with some ongoing questions here
Indicator chemicals or components
METHODS
Detecting optical brighteners
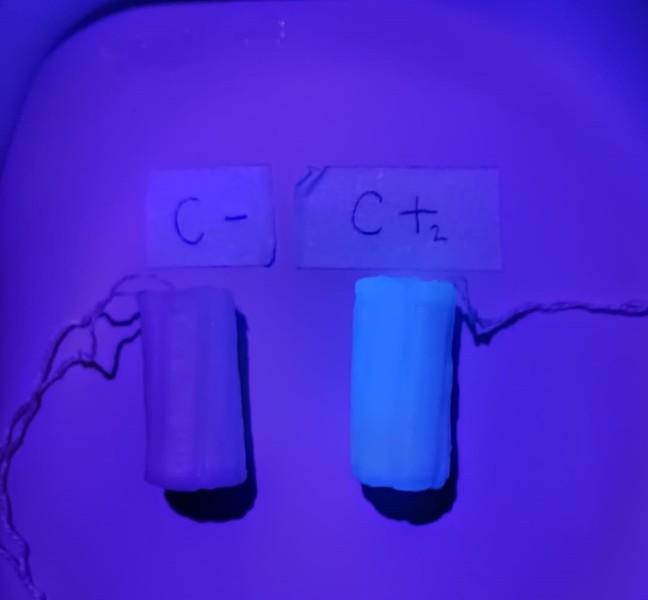
UV light makes a tampon exposed to optical brighteners glow brightly. In the positive control on the right, the tampon was soaked in laundry detergent. From this note by @alejobonifacio.
Organic waste and oxygen
Certain bacteria help to clean water by breaking down organic wastes, and they use oxygen in the process. Measuring the amount of oxygen in water and how readily it might be used can help create a picture of how much organic waste is present and how well it’s breaking down.
| Title | Author | Updated | Likes | Comments |
|---|---|---|---|---|
| Monitor transparency, dissolved oxygen, ORP, and ammonia from a river | @shanlter | over 7 years ago | 4 | 4 |
| Live Dissolved Oxygen and Redox Potential Sensor | @jesseslone | over 7 years ago | 3 | 8 |
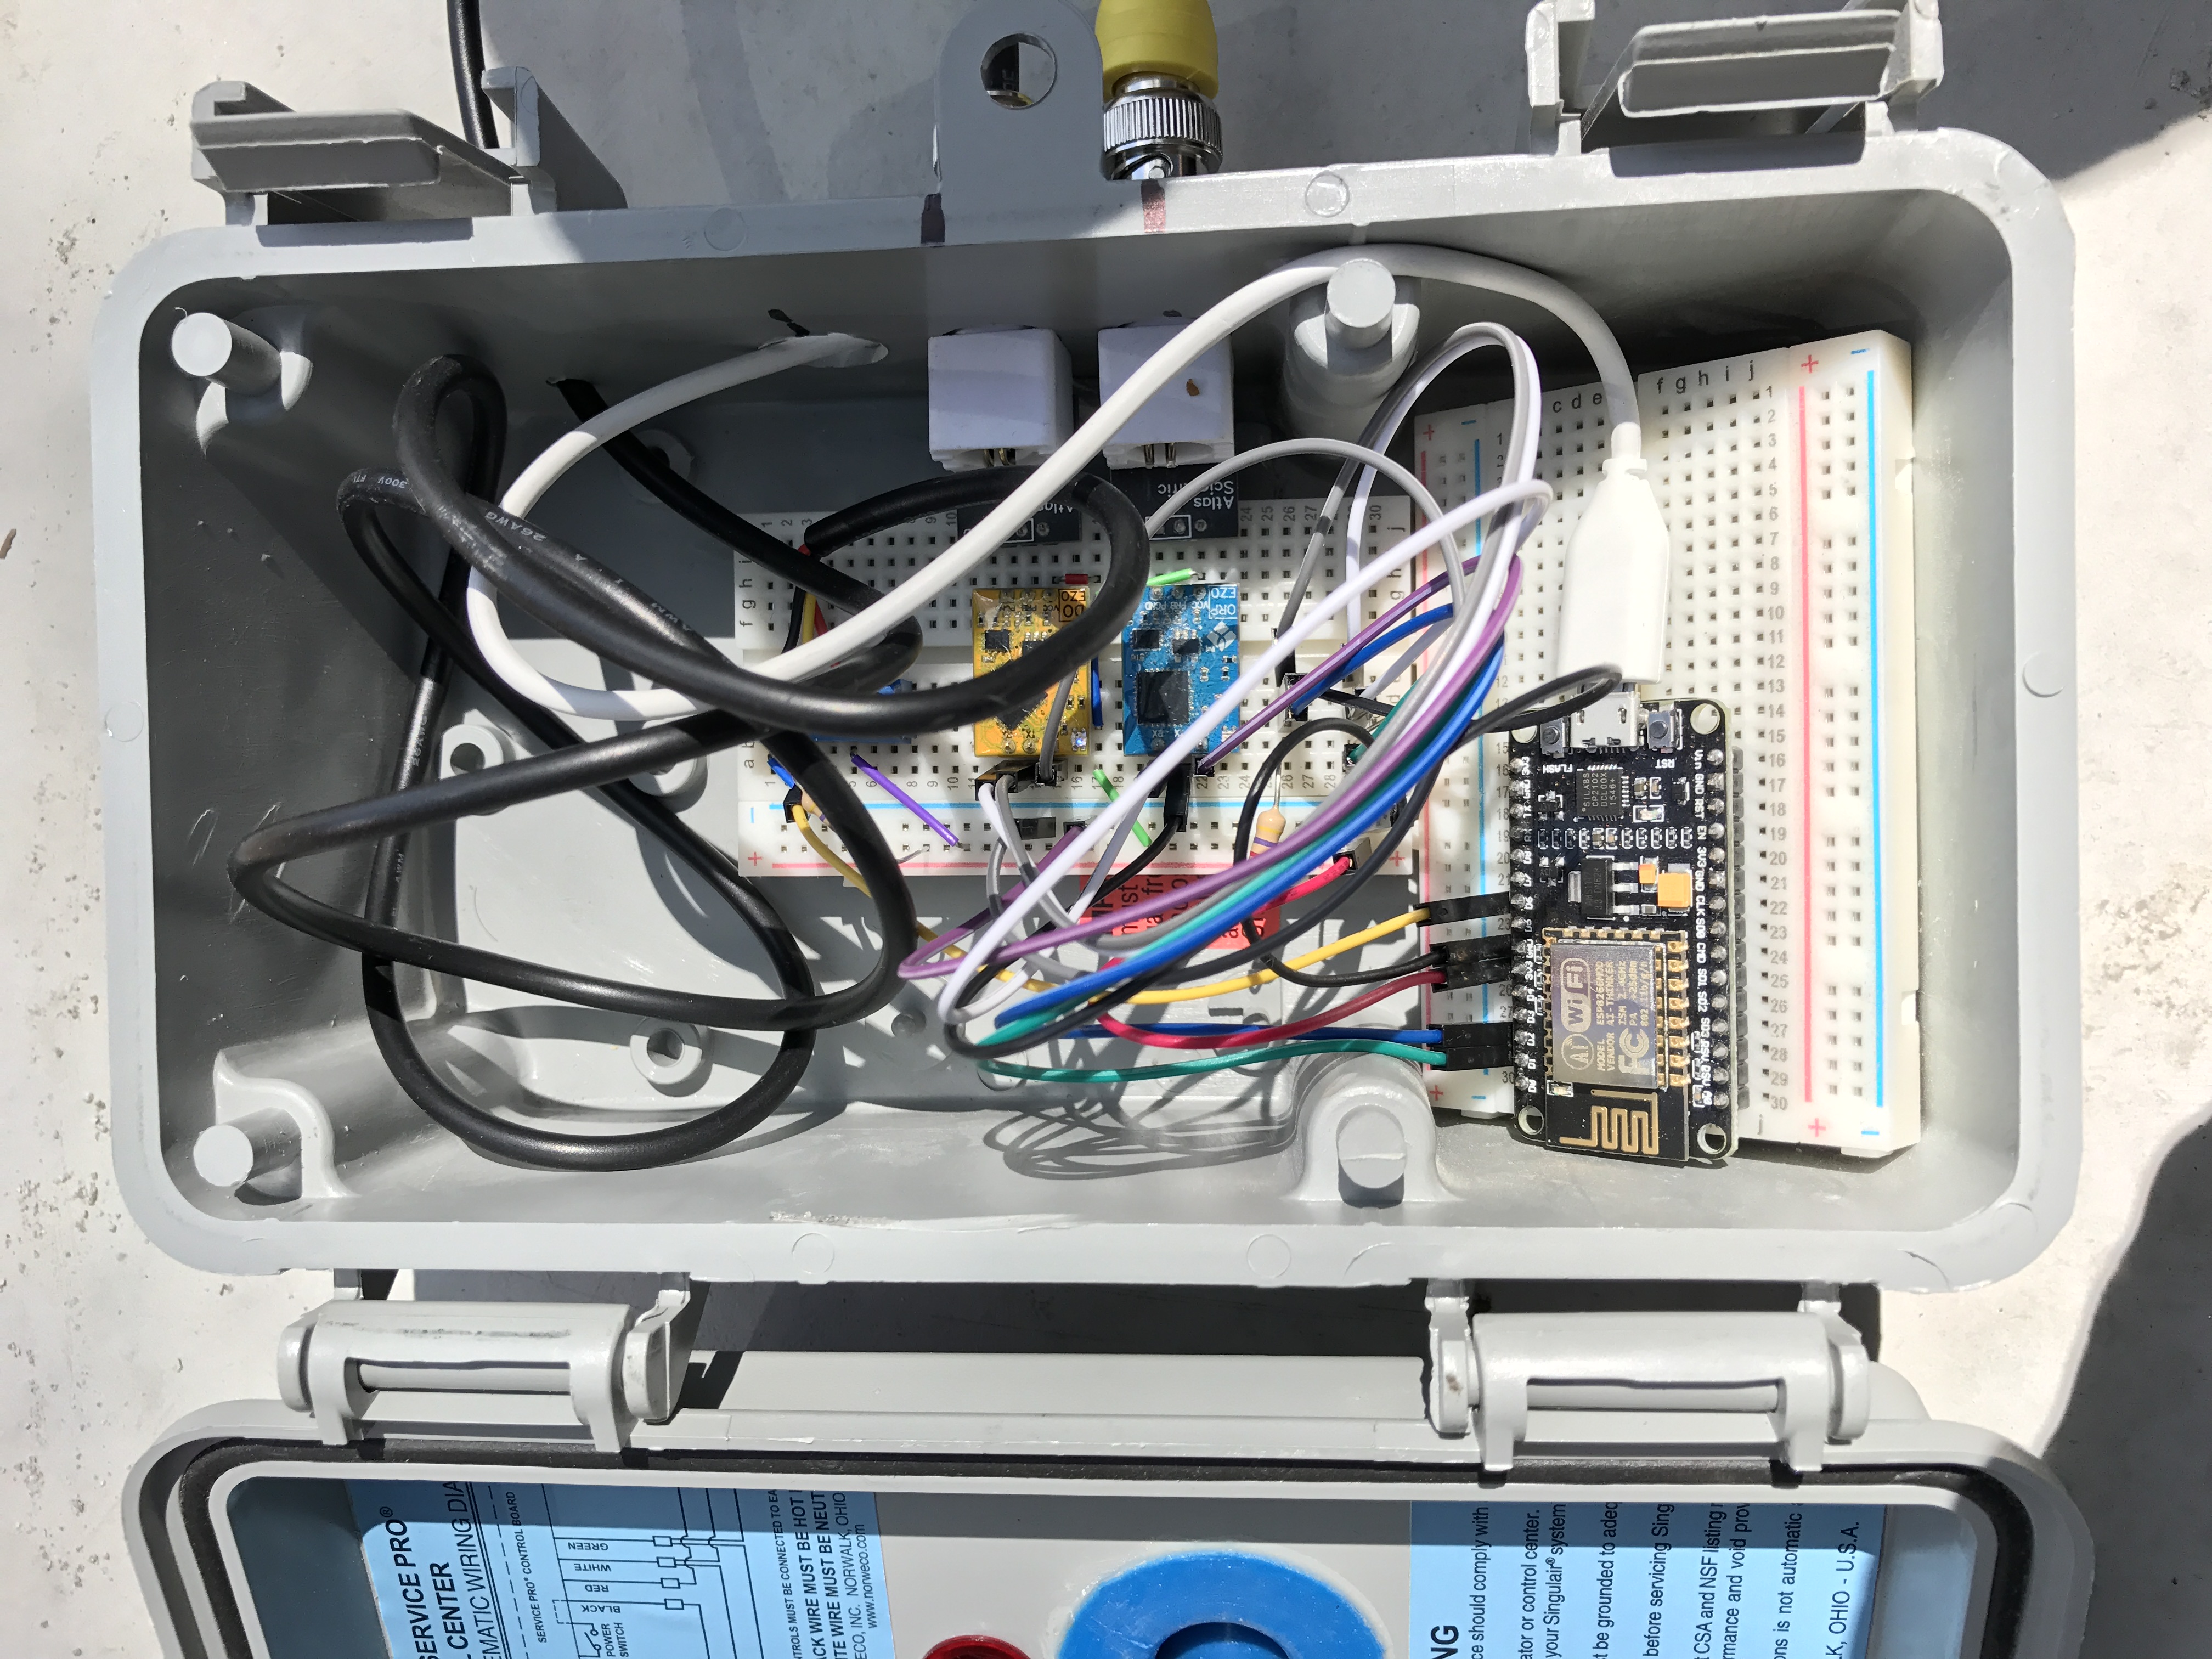
Do-it-yourself dissolved oxygen (DO) and oxidation-reduction potential (ORP) sensor for monitoring a small wastewater treatment system. From this note by @jesseslone.
There are also ways to use spectroscopy to detect organic matter (see below)
Bioindicators and bioassays
Using living things to help indicate or measure impacts from polluted water. Changes in the survival or growth of certain plants, animals, and microorganisms in water can indicate worsening water quality.
image to come here!
- Sampling water and looking for microscopic organisms as living indicators (called bioindicators) of possible wastewater pollution, with the help of DIY microscopes: https://publiclab.org/wiki/bioindicators
- Exposing test organisms to sampled water and measuring growth: https://publiclab.org/wiki/bioassay
- Detecting fecal bacteria (e.g., enterococci and E. coli) in sewage: the common water contaminants wiki page lists a couple ways to test for fecal bacteria.
Activities on bioindicators
| Purpose | Category | Status | Author | Time | Difficulty | Replications |
|---|---|---|---|---|---|---|
| Activity: Learning to Spot Lichens and Mosses | observe | - | @fongvania | 1h | easy | 0 replications: Try it » |
| ¿Cómo evaluar la calidad de un río con insectos acuáticos (bioindicadores)? / How do I assess the quality of an river with aquatic insects (bioindicators)? | - | - | @alejobonifacio | - | - | 0 replications: Try it » |
| Activity: Air Pollution Gardens | - | - | @fongvania | - | - | 0 replications: Try it » |
| Activity: Lichens for Qualitative Air Quality Determination | observe | - | @fongvania | - | easy | 0 replications: Try it » |
Activities should include a materials list, costs and a step-by-step guide to construction with photos. Learn what makes a good activity here.
Spectrometry methods for wastewater: a grab bag
Lots of people at Public Lab are interested in spectrometry and have experience using spectrometers for environmental monitoring. We’re collecting some approaches for detecting various things related to wastewater here:
- How can we detect contaminants in water samples with a DIY spectrometer using reagents?
- Detecting organic dyes in wastewater: Fabrication of a Smartphone-Based Spectrophotometer and Its Application in Monitoring Concentrations of Organic Dyes, by Koohkan et al. 2020.
- Detecting rapid changes in UV/vis spectra, as an indicator for changes in incoming wastewater concentration and composition: Real-time detection of possible harmful events using UV/vis spectrometry, by Langergraber et al. 2006.
Some emerging research:
- Fluorescence spectrometry for detecting distinct “signatures” of organic wastewater:
“Human wastewater has distinct optical properties that are different than those typically observed in natural waters” - pg. 8, Detection of Wastewater Contamination, the Water Environment Federation
Some preliminary results showing the fluorescence signals of sewage vs. surface water, from Using optical sensors to detect sewage contamination in the Great Lakes:
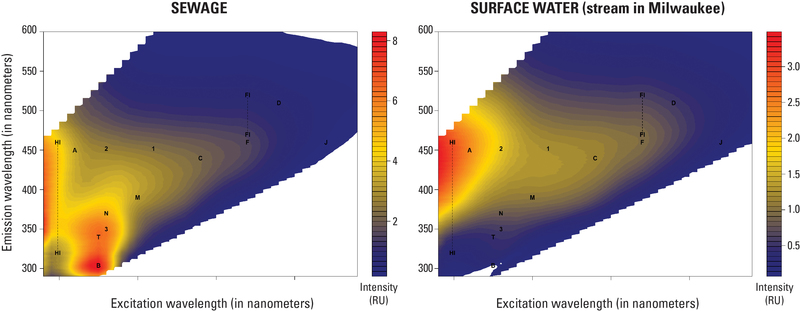
Different fluorescence signals from sewage and stream samples measured using a laboratory-based instrument. Public domain image from this USGS project.
The Public Lab Oil Testing Kit uses fluorescence spectrometry to detect and identify oil pollution
Questions
Questions tagged with question:detecting-wastewater will appear here
| Title | Author | Updated | Likes | Comments |
|---|---|---|---|---|
| What are some observable tell-tale signs of wastewater pollution? | @bhamster | over 3 years ago | 1 | 11 |
Activities
Activities tagged with activity:detecting-wastewater will appear here
Activities should include a materials list, costs and a step-by-step guide to construction with photos. Learn what makes a good activity here.
More resources and references
- Table 5: Techniques for detection of wastewater contamination, pros and cons of each method, and relative cost, pg. 12, from the Water Environment Federation
- Koohkan R., Kaykhaii M., Sasani M., and Paull B. 2020. Fabrication of a Smartphone-Based Spectrophotometer and Its Application in Monitoring Concentrations of Organic Dyes. ACS Omega, 5: 31450-31455. LINK here.