Purpose
We are making an Arduino-based liquid turbidity sensor that displays readings using a single flashing LED and sends data to a computer or smartphone/tablet over USB by emulating a keyboard.
The goal of this project is to have a basic design for cheap, easy to build, water quality sensors that can be used to log quantitative data without requiring additional software, drivers, or a complicated circuit.
For more information about the design of the project see Designing A Simple Water Sensor Kit.
We are using the DF Robot Turbidity Sensor for this prototype kit primarily because it is relatively cheap and measures something that's easy to understand and see. All of the DF Robot liquid sensors (and many other Arduino-based sensors) share a common basic interface, so it would be very easy to swap out and experiment with different sensors based on what you want to be measuring.
This is a prototype project, so we would very much appreciate any thoughts or feedback you have on the design or documentation, as well as on how you might want to use these kinds of water quality sensors in your own projects and campaigns.
Materials needed
- DF Robot Analog Turbidity Sensor - $9.90 from DF Robot, $15.00 (Amazon)
.jpg")
- Mini-Breadboard - $6.98 for 6 (Amazon)
- Arduino Micro - $18.89 for 3 (Amazon), $4 (Ebay)

- Switch or Button - $7 for 15 rocker switches (Amazon), $8.29 for 12 push-button switches (Amazon)

- 3 Male to Male Jumper Wires (Red, Black, Blue) - $9.99 for 80 -- assorted colors (Amazon), $6.55 for 100 with choice of color (AliExpress)

- USB Micro Cable - $7 for 3 (Amazon)
.jpg")
- An LED - $6.55 for 100 (Amazon)

- A laptop, smartphone, or tablet with a USB port to plug in the sensor
- A USB "on the go" cable (if using a phone/tablet) - $5 for 3 (Amazon)
Step 1 - Assemble the Turbidity Sensor
The DFRobot Turbidity sensor consists of two parts, the sensor probe and the circuit board. This can be connected to each other and to your Arduino with the included sets of wires.
The sensor probe can be connected to the circuit board using the included BLACK-YELLOW-RED set of 3 wires.
These wires have a white plastic connector on both sides that will allow you to plug them into sockets on the sensor probe and the circuit board.
Start by plugging the wire into the plug on the circuit board.
NOTE: These wires are NOT reversible. Make sure the correct side of the wires is connected to the circuit board.
If you are looking at the circuit board from the top with the writing right-side-up, you will plug the wire into the socket on the left side of the board.
The BLACK wire will be the top wire, with YELLOW in the middle and RED on the bottom.
The plug on the other side of the wire has a small plastic clip on top of it but is otherwise identical and will fit into this socket but the wires go RED BLACK YELLOW. This setup is incorrect.
Plug the other side of the wires to the socket on the sensor probe
The other side of the set of wires has a small tab on the top of the plug and has a color-order of RED-BLACK-YELLOW. Plug this side into the socket on the bottom of the sensor-probe.

Note: if the board and probed are arranged in this way, then the wiring should be as follows:_
- TOP wire on board connected to the BOTTOM wire on the probe
- MIDDLE wire on board connected to TOP wire on probe
- BOTTOM wire on board connected to MIDDLE wire on probe
Step 2 - Insert the Arduino Micro into the Breadboard
The Arduino Micro has two rows of "header pins" coming off of the bottom. These pins can fit into the sockets in your breadboard.
The Arduino has two rows of header pins. The breadboard has a break down the middle. Insert the Arduino so that the rows of pins are on opposite sides of the break.
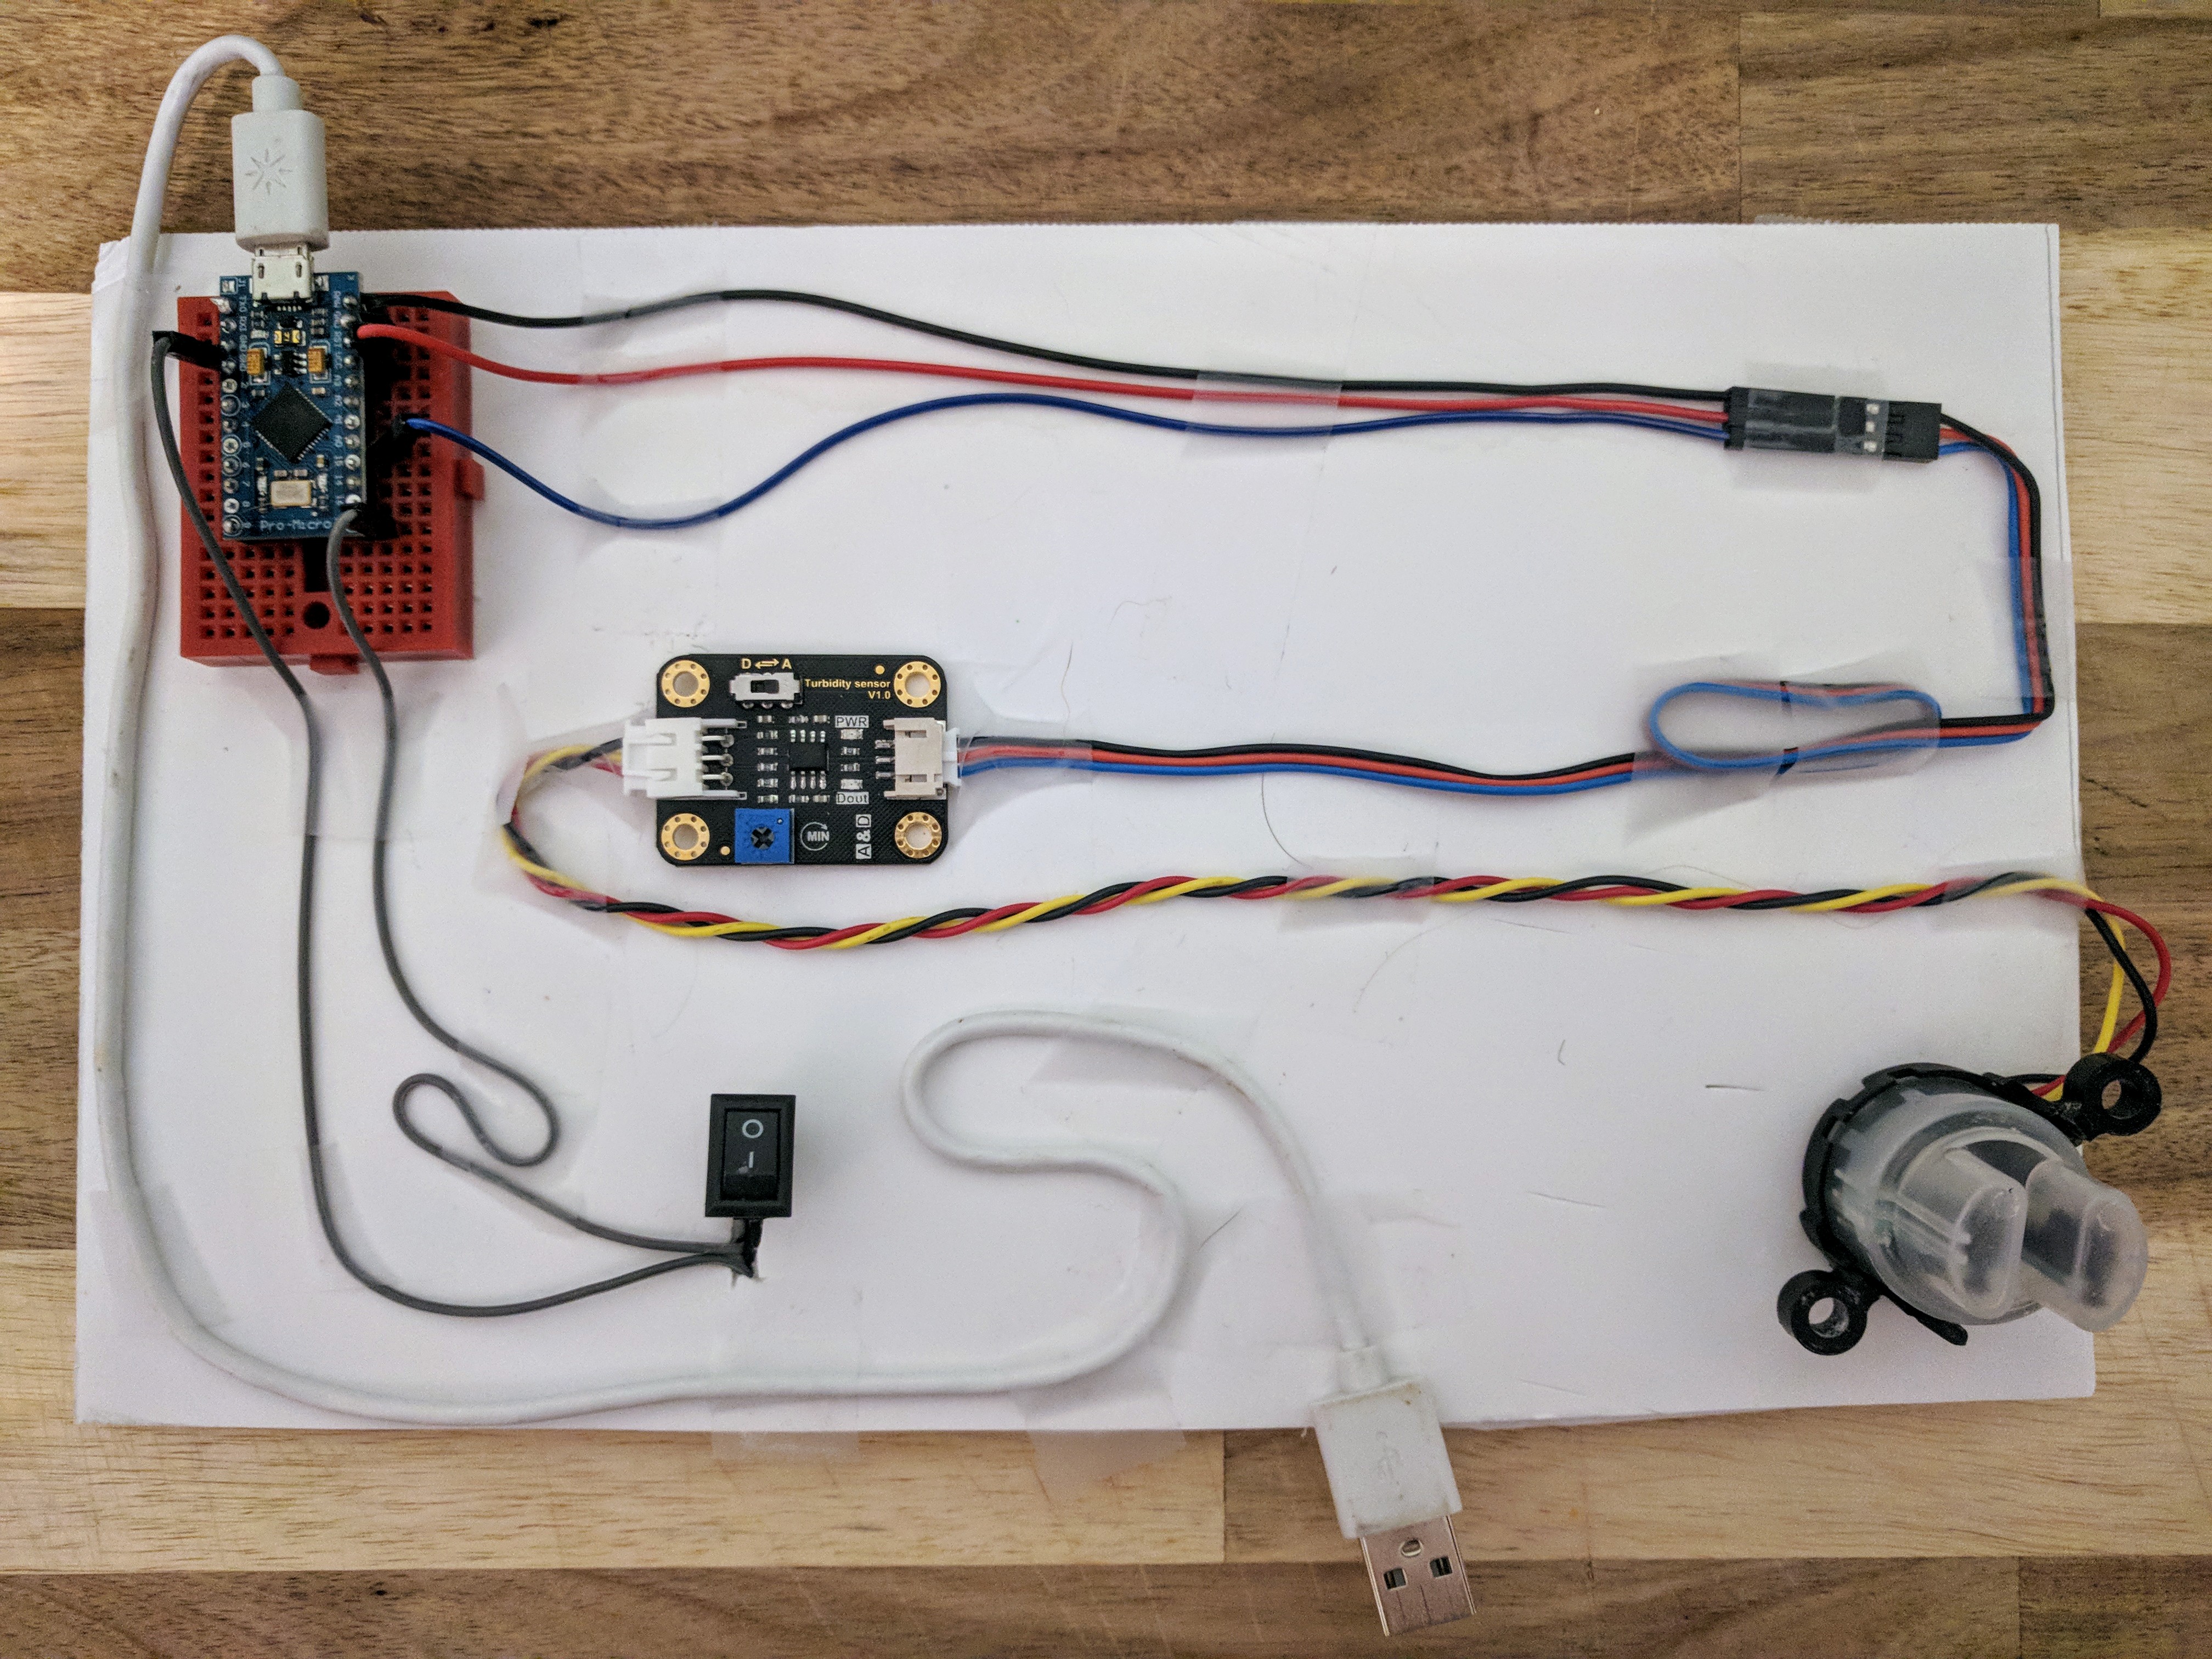
Step 3 - Build the Circuit
The completed circuit will look something like this:

Step A: Connect Sensor to Arduino with Jumper Wires

We will use the Male to Male jumper wires to connect the Arduino to the sensor by plugging them into sockets on the breadboard. The pins on the Arduino are labelled on the circuit board. We will connect the wires as follows:
| Arduino Pin | Label | Wire Color |
|---|---|---|
| Power (+) | VCC | RED |
| Ground (-) | GND | BLACK |
| Analog 0 | A0 | BLUE |
Step B: Plug in the LED

The LED has two legs, one longer, one shorter. They should be connected as follows:
| Arduino Pin | Label | LED Leg |
|---|---|---|
| Digital I/O Pin 2 | 2 | LONG |
| Ground (-) | GND | SHORT |
If the LED is plugged in backwards it will not light up.
Step C: Connect the Switch
For this part you could either use a momentary push-button switch or a rocker switch. I have not decided which makes the most sense for this project.
Both the Switch and the button have two connections coming off of them. These wires are interchangable -- it doesn't matter which one you connect to which pin. The switch just needs to connect **PIN 10 **to **GND **on the Arduino.
In this picture the grey wires are attached to the switch.

With the push-button switch it will type out readings as long as you hold the button down. With the rocker switch it will type out readings while the switch is in the "on" position.
It is inconvenient to have to hold the push-button down all of the time while you are collecting data. On the other hand it is easy to leave the rocker-switch on, and accidentally have the sensor be typing data into your computer while you're trying to do something else if you aren't careful. Neither of these are really huge problems. I think the rocker-switch is probably preferable but am leaving the question open for now.
Program the Arduino
If you got this project as a kit, hopefully you received a pre-programmed Arduino. If so, you can skip this step. Otherwise, you will need to use the Arduino IDE to send the correct code to the Arduino. The test code that I am using right now looks like this:
and you can copy and paste it into the Arduino IDE and hit the "upload" button. For more information, see my [note on testing and setup of the Arduino](https://publiclab.org/notes/wmacfarl/10-22-2019/how-to-set-up-and-test-an-arduino).
Note: if you are using the Arduino Micro you will need to choose either "Arduino Micro" or "Arduino Leonardo" as your "Board" in the "Tools" menu.

Test the Sensor
There is a switch on the sensor board labelled D<-->A that can be used to set whether the sensor outputs data in "Digital" or "Analog" mode. Before you attempt to get any data from the sensor you need to make sure that it is set to "Analog" mode.

If the sensor is in "Digital" mode it will output a HIGH voltage (4-4.5V) if the turbidity-reading is above a certain threshold and will output a LOW voltage (0-.5V) if it is below that threshold. You can adjust this threshold by turning the small blue+grey screw below the switch.
This is a useful feature if you are using the sensor as part of a control system -- like if you wanted to automatically trigger a pump or filter when the water got too dirty -- but is not useful if we want to be collecting data over a range of values.
You don't need any liquid at all to test whether the sensor is working. Since the turbidity sensor works by shining a light through the liquid towards a sensor and measuring how much light makes it through, you can place any opaque object between the two probes of the sensor and you should be able to see a change.
If you are testing the sensor with a liquid, you should be aware that the casing is not waterproof. Be careful only to submerge the probes and not the rest of the sensor so you don't get water in the casing and on the circuit board.
If you just want to see if the sensor is working, you don't need to turn the switch on to send data back to the computer, you can just look at the LED, The LED will blink faster with higher turbidity.
If you want to collect data, you just need to open up any spreadsheet software, place your cursor on whatever cell you want to start typing into, and then turn the switch on. It will type out a table that looks like this:
| |
|
|
|---|---|---|
| Voltage: | 3.41 | now_ |
| Voltage: | 3.40 | now_ |
| Voltage: | 3.41 | now_ |
I am using a simple script that I have written for Google Sheets that replaces the word "now_" with the current date and time. So the resulting spreadsheet looks like this:
If you have a Google account you can look at my spreadsheet here and make your own copy of it. The copy you make _should _have my script attached.
It should be possible to do something similar with any other piece of spreadsheet software.
Questions and Considerations
This project is still a prototype/proof-of-concept. In particular, off the top of my head:
- the Arduino code could be improved and made simpler
- a better non-google spreadsheet could be made for collecting data
- web software could be written to do all sorts of useful things, from processing sensor data to interfacing with this, and other, websites
- we currently have no design for the body/housing of the sensor
And there are probably lots of other problems and things to improve on. I would love any feedback, thoughts, or questions you might have.
12 Comments
I did this!
My first error it was a silly mistake - the yellow/red/black cable was plugged in backwards. "apparently" it makes a difference which end goes where (this is what i get for skimming the instructions, they're very clear above)
...coffee is measured! ☕️
and -- faster blinking is high turbidity -- blocking it entirely made it blink super fast, while measuring nothing (open air) was about 1 blink per second.
Will, i hope it's all right, i noticed a small error because the < character was clipped out in the script, so I fixed it an copied it into an Arduino Create sketch, and embedded that. I'm able to program the Micro from Arduino Create, on my chromebook, which is nice and convenient!
Is this a question? Click here to post it to the Questions page.
Reply to this comment...
Log in to comment
We have 4 turbidity sensors up and running thanks to Will's very clear and helpful instructions! Excited to use them for the event tonight.
I do have a couple of small notes about how the sensor interfaces with Google Sheets:
First -- Users should make sure their spreadsheet is open and they have selected the first cell they'd like to display data in before flipping the "on" switch. Otherwise the page might refresh a bunch of times, or type data in a different column than desired.
Second -- The script to grab the time isn't working for me for some reason. When I simply type "now" in a cell on Sheets, the script does work. But it does not seem to be replacing "now" with the time when I am grabbing data from the turbidity sensor. Any troubleshooting tips? There's a video of my issue here: https://www.loom.com/share/5889e88ea5f34425837cac3b0e5dc95c
Is this a question? Click here to post it to the Questions page.
Oh, it looks like the sensor is sending "_now" instead of "now"...
I wonder is it possible to modify the spreadsheet script to match that?
Is this a question? Click here to post it to the Questions page.
Hmm, the script is:
function onEdit(e) {
    var val = e.range.getValue().toString();
  if (val.indexOf('_now') !== -1) {
    e.range.setValue(Date());
  }
}
so it looks OK! Hmm.
That is really odd. I tried a couple other things but can't figure out why this is happening. In theory it should just be pressing the tab key between each value. But just like your video, the
_nowentries don't get converted.The script will miss substitutions if the data is coming in too quickly -- I put a bunch of delays in the code to slow it down to a point where it worked for me but I didn't delve too deeply into the issue.
You could try increasing the "delay" values in the arduino code and see if that helps. The amount of delay that you need might be related to the latency of your internet connection.
It could also potentially be an operating system issue with endline characters? This seems unlikely since the line of code in question is: Keyboard.press(KEY_RETURN);
which seems like it should be endline-character-agnostic but I would have to dig a little bit deeper into the Arduino keyboard library to know.
There might be a better way to write the spreadsheet script that I haven't thought about that avoids the issue of however google script handles rapid onEdit events....
Is this a question? Click here to post it to the Questions page.
Yeah my comment came out odd due to markdown -- the underscore is present in both the Arduino code and the script.
I was wondering whether it was some sort of issue with grabbing continuous data, but even when I switch to using a button so I can grab a single data point, the same thing happens.
Not a huge issue for what we're doing tonight, but maybe we can pick Will's brain when he's back in action.
So, i realized entering
control-shift-;in a google spreadsheet enters the exact time/date in a cell. Maybe we can modify the Arduino code to send that? It would only work on Google Spreadsheets, but i think it would probably not break other spreadsheets?Is this a question? Click here to post it to the Questions page.
Reply to this comment...
Log in to comment
Love this build and excited to work more with these sensors. Thanks for putting together such great instructions.
I had a chance to work with one of these sensors yesterday, and I wonder if the LED is the best way we can show a quick change in the turbidity. When testing samples that we could see a clear difference in visually and via sensor reading, the change in the rate of LED flashing was so small we couldn't easily visualize it.
I wonder if we could make the LED more sensitive to these changes someway or perhaps use sound and a buzzer like the Coquí?
Is this a question? Click here to post it to the Questions page.
Maybe we could do both sound and light? That way it is adaptable for different abilities too.
I don't know if we could have one port drive a light, slowly, and a second port drive a buzzer, 10x speed?
Secondly, I was also thinking of sensitivity, and had thought of a logarithmic scale. But, that could add some complexity in reading it, like, blinking 2x as fast means... uh... see, i can't even do that in my head, but i'm not great at this kind of math. Maybe there's another way to add resolution to the blink, without losing range?
Thanks for the input!
Is this a question? Click here to post it to the Questions page.
Reply to this comment...
Log in to comment
Login to comment.