Revisions for Spectrometer
| 138 | warren |
December 22, 2011 19:44
| about 13 years ago
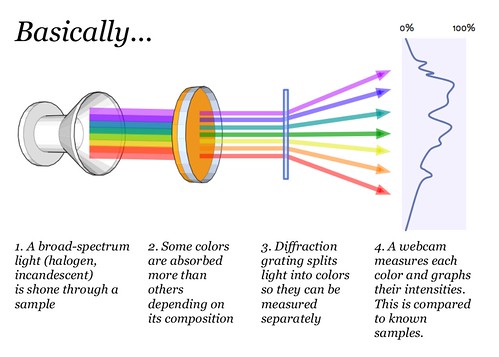
PurposeChemists use expensive tools called spectrometers (there are several kinds) to analyze unknown solid or liquid samples. We are working on a cheap version which we hope to use to identify oil contamination in water and soil, as well as a range of other possible toxins. Spectrometers can also be used to identify species of plants or crop diseases, assess plumes from smokestacks, and have many other applications. What's spectrometry?What we perceive as a single color consists of multiple blended colors- just as green paint can be made from mixing yellow and blue paint. A spectrometer is a device that splits light into the various colors it is composed of, which we otherwise cannot distinguish with the naked eye. By viewing a substance through a spectrometer, one can distinguish the exact mixture of colors, which correspond to specific wavelengths of light, that make up the perceived color of the sample.
Make your own inexpensive spectrometerThe PLOTS spectrometer is a Do-it-Yourself tool made from simple materials:
The DVD's tightly packed grooves act as a diffraction grating -- basically a prism. When light enters, the different wavelengths of light are bent to different degrees, forming a rainbow -- a spectrum. Video spectrometer construction offers step-by-step instructions on making your own spectrometer. This design is released under the CERN Open Hardware License 1.1 (read agreement here). It features:
UsageOne group of toxins common to fossil fuel contamination are PAHs, polycyclic aromatic hydrocarbons, which are generally carcinogenic. Directions for using your spectrometer are in progress (please chip in to expand this documentation!) and can be found at: Online spectral analysisAlong with the physical tool itself, the PLOTS team has also developed a software suite and [online spectrum sharing website](https://spectralworkbench.org] which allows anyone to upload their data and work with others to try to interpret it. These tools are early prototypes and we're looking for help developing them. Resources, Downloads, FAQSeveral older designs have been documented on this site. Guides have been made showing you how to make some of these; they include:
Finally, a FAQ with some insights about actually using your spectrometer can be found here: |
Revert | |
| 137 | warren |
December 22, 2011 19:31
| about 13 years ago
PurposeChemists use expensive tools called spectrometers (there are several kinds) to analyze unknown solid or liquid samples. We are working on a cheap version which we hope to use to identify oil contamination in water and soil, as well as a range of other possible toxins. Spectrometers can also be used to identify species of plants or crop diseases, assess plumes from smokestacks, and have many other applications. What's spectrometry?What we perceive as a single color consists of multiple blended colors- just as green paint can be made from mixing yellow and blue paint. A spectrometer is a device that splits light into the various colors it is composed of, which we otherwise cannot distinguish with the naked eye. By viewing a substance through a spectrometer, one can distinguish the exact mixture of colors, which correspond to specific wavelengths of light, that make up the perceived color of the sample.
Make your own inexpensive spectrometerThe PLOTS spectrometer is a Do-it-Yourself tool made from simple materials:
The DVD's tightly packed grooves act as a diffraction grating -- basically a prism. When light enters, the different wavelengths of light are bent to different degrees, forming a rainbow -- a spectrum. Learn how to make one here: Video spectrometer construction This design is released under the CERN Open Hardware License 1.1 (read agreement here). It features:
UsageOne group of toxins common to fossil fuel contamination are PAHs, polycyclic aromatic hydrocarbons, which are generally carcinogenic. ... Online spectral analysisAlong with the physical tool itself, the PLOTS team has also developed an online application which allows anyone to upload a spectrum photographed with a digital camera to the website, and use the online tool to analyze the intensity of the spectrum. The intensity of the spectrum at each wavelength adds a second dimension to the data, allowing for more accurate comparisons to known spectrums. Another tutorial: Resources, Downloads, FAQAccess the online tool at: https://spectralworkbench.org Several guides have been made showing you how to make a spectrometer. Make a Spectrometer - Alex McCarthy And another prepared by the PLOTS team for our workshop at the Whitney Museum, here: plots-spectrometer-guide-small.pdf Finally, a FAQ with some insights about actually using your spectrometer can be found here: |
Revert | |
| 136 | warren |
December 22, 2011 19:18
| about 13 years ago
PurposeChemists use expensive tools called spectrometers (there are several kinds) to analyze unknown solid or liquid samples. We are working on a cheap version which we hope to use to identify oil contamination in water and soil, as well as a range of other possible toxins. Spectrometers can also be used to identify species of plants or crop diseases, assess plumes from smokestacks, and have many other applications. What's spectrometry?What we perceive as a single color consists of multiple blended colors- just as green paint can be made from mixing yellow and blue paint.
A spectrometer is a device that splits light into the various colors it is composed of, which we otherwise cannot distinguish with the naked eye. By viewing a substance through a spectrometer, one can distinguish the exact mixture of colors, which correspond to specific wavelengths of light, that make up the perceived color of the sample.
The Tool:The PLOTS spectrometer is a DIY tool made from simple materials: cardboard, tape, a CD, and a digital camera. The CD is the key component: the tightly packed grooves in the CD act as a diffraction grating. When light enters a diffraction grating, the different wavelengths of light are bent to different degrees, proportionally to their wavelength, splitting the light into its component wavelengths. There are several versions of the spectrometer:
The Application:It is the ultimate goal for this research to use the PLOTS spectrometer to identify contaminants stemming from fossil fuels in water and air samples. With these capabilities, the spectrometer could be used to identify pollution due to oil spills (Gulf Coast), industrial activity (Gowanus Canal, NY), or natural gas extraction. One group of toxins common to fossil fuel contamination are PAHs, polycyclic aromatic hydrocarbons, which are generally carcinogenic. The PLOTS spectrometer aims to be cheap, easy to manufacture, and easy to use, which could empower people concerned about fossil fuel contamination by giving them the tools to test for pollution, and raise awareness about the problem. The spectrometer has also been the subject of a public workshop by Jeff Warren and Nadya Peek at Escuelab in collaboration with FabLabLima in Lima, Peru: http://publiclaboratory.org/report/diy-spectrometry-workshop-lima-peru
Online spectral analysisAlong with the physical tool itself, the PLOTS team has also developed an online application which allows anyone to upload a spectrum photographed with a digital camera to the website, and use the online tool to analyze the intensity of the spectrum. The intensity of the spectrum at each wavelength adds a second dimension to the data, allowing for more accurate comparisons to known spectrums. Another tutorial: Resources, Downloads, FAQAccess the online tool at: https://spectralworkbench.org Several guides have been made showing you how to make a spectrometer. Make a Spectrometer - Alex McCarthy And another prepared by the PLOTS team for our workshop at the Whitney Museum, here: plots-spectrometer-guide-small.pdf Finally, a FAQ with some insights about actually using your spectrometer can be found here: |
Revert | |
| 135 | warren |
December 22, 2011 18:41
| about 13 years ago
PurposeChemists use expensive tools called spectrometers (there are several kinds) to analyze unknown solid or liquid samples. We are working on a cheap version which we hope to use to identify oil contamination in water and soil, as well as a range of other possible toxins. Spectrometers can also be used to identify species of plants or crop diseases, assess plumes from smokestacks, and have many other applications. What's spectrometry?What we often perceive as a single color actually consists of multiple blended colors- just as green paint can be made from mixing yellow and blue paint. A spectrometer is a device that splits light into the various colors it is composed of, which we otherwise cannot distinguish with the naked eye. The particle upshot of this is that by viewing a substance through a spectrometer, one can distinguish the exact mixture of colors, which correspond to specific wavelengths of light, that make up the perceived color of the sample.
The Tool:The PLOTS spectrometer is a DIY tool made from simple materials: cardboard, tape, a CD, and a digital camera. The CD is the key component: the tightly packed grooves in the CD act as a diffraction grating. When light enters a diffraction grating, the different wavelengths of light are bent to different degrees, proportionally to their wavelength, splitting the light into its component wavelengths. There are several versions of the spectrometer:
The Application:It is the ultimate goal for this research to use the PLOTS spectrometer to identify contaminants stemming from fossil fuels in water and air samples. With these capabilities, the spectrometer could be used to identify pollution due to oil spills (Gulf Coast), industrial activity (Gowanus Canal, NY), or natural gas extraction. One group of toxins common to fossil fuel contamination are PAHs, polycyclic aromatic hydrocarbons, which are generally carcinogenic. The PLOTS spectrometer aims to be cheap, easy to manufacture, and easy to use, which could empower people concerned about fossil fuel contamination by giving them the tools to test for pollution, and raise awareness about the problem. The spectrometer has also been the subject of a public workshop by Jeff Warren and Nadya Peek at Escuelab in collaboration with FabLabLima in Lima, Peru: http://publiclaboratory.org/report/diy-spectrometry-workshop-lima-peru
Online spectral analysisAlong with the physical tool itself, the PLOTS team has also developed an online application which allows anyone to upload a spectrum photographed with a digital camera to the website, and use the online tool to analyze the intensity of the spectrum. The intensity of the spectrum at each wavelength adds a second dimension to the data, allowing for more accurate comparisons to known spectrums. Another tutorial: Resources, Downloads, FAQAccess the online tool (still a prototype) at: http://spectrometer.publiclaboratory.org You can find instructions for making your own spectrometer by Alex McCarthy here: And another prepared by the PLOTS team for our workshop at the Whitney Museum, here: plots-spectrometer-guide-small.pdf Finally, a FAQ with some insights about actually using your spectrometer can be found here: |
Revert | |
| 134 | warren |
December 22, 2011 18:33
| about 13 years ago
PurposeChemists use expensive tools called spectrometers (there are several kinds) to analyze unknown solid or liquid samples. We are working on a cheap version which we hope to use to identify oil contamination in water and soil, as well as a range of other possible toxins. Spectrometers can also be used to identify species of plants or crop diseases, assess plumes from smokestacks, and have many other applications. What's spectrometry?What we often perceive as a single color actually consists of multiple blended colors- just as green paint can be made from mixing yellow and blue paint. A spectrometer is a device that splits light into the various colors it is composed of, which we otherwise cannot distinguish with the naked eye. The particle upshot of this is that by viewing a substance through a spectrometer, one can distinguish the exact mixture of colors, which correspond to specific wavelengths of light, that make up the perceived color of the sample.
The Tool:The PLOTS spectrometer is a DIY tool made from simple materials: cardboard, tape, a CD, and a digital camera. The CD is the key component: the tightly packed grooves in the CD act as a diffraction grating. When light enters a diffraction grating, the different wavelengths of light are bent to different degrees, proportionally to their wavelength, splitting the light into its component wavelengths. There are several versions of the spectrometer:
The Application:It is the ultimate goal for this research to use the PLOTS spectrometer to identify contaminants stemming from fossil fuels in water and air samples. With these capabilities, the spectrometer could be used to identify pollution due to oil spills (Gulf Coast), industrial activity (Gowanus Canal, NY), or natural gas extraction. One group of toxins common to fossil fuel contamination are PAHs, polycyclic aromatic hydrocarbons, which are generally carcinogenic. The PLOTS spectrometer aims to be cheap, easy to manufacture, and easy to use, which could empower people concerned about fossil fuel contamination by giving them the tools to test for pollution, and raise awareness about the problem. The spectrometer has also been the subject of a public workshop by Jeff Warren and Nadya Peek at Escuelab in collaboration with FabLabLima in Lima, Peru: http://publiclaboratory.org/report/diy-spectrometry-workshop-lima-peru
Online spectral analysisAlong with the physical tool itself, the PLOTS team has also developed an online application which allows anyone to upload a spectrum photographed with a digital camera to the website, and use the online tool to analyze the intensity of the spectrum. The intensity of the spectrum at each wavelength adds a second dimension to the data, allowing for more accurate comparisons to known spectrums. Another tutorial: Resources, Downloads, FAQAccess the online tool (still a prototype) at: http://spectrometer.publiclaboratory.org You can find instructions for making your own spectrometer by Alex McCarthy here: And another prepared by the PLOTS team for our workshop at the Whitney Museum, here: plots-spectrometer-guide-small.pdf Finally, a FAQ with some insights about actually using your spectrometer can be found here: |
Revert | |
| 133 | warren |
December 20, 2011 21:34
| about 13 years ago
IntroductionWhat we often perceive as a single color actually consists of multiple blended colors- just as green paint can be made from mixing yellow and blue paint. A spectrometer is a device that splits light into the various colors it is actually composed of, which we otherwise cannot distinguish with the naked eye. The particle upshot of this is that by viewing a substance through a spectrometer, one can distinguish the exact mixture of colors, which correspond to specific wavelengths of light, that make up the perceived color of the sample.
The Tool:The PLOTS spectrometer is a DIY tool made from simple materials: cardboard, tape, a CD, and a digital camera. The CD is the key component: the tightly packed grooves in the CD act as a diffraction grating. When light enters a diffraction grating, the different wavelengths of light are bent to different degrees, proportionally to their wavelength, splitting the light into its component wavelengths. There are several versions of the spectrometer:
The Application:It is the ultimate goal for this research to use the PLOTS spectrometer to identify contaminants stemming from fossil fuels in water and air samples. With these capabilities, the spectrometer could be used to identify pollution due to oil spills (Gulf Coast), industrial activity (Gowanus Canal, NY), or natural gas extraction. One group of toxins common to fossil fuel contamination are PAHs, polycyclic aromatic hydrocarbons, which are generally carcinogenic. The PLOTS spectrometer aims to be cheap, easy to manufacture, and easy to use, which could empower people concerned about fossil fuel contamination by giving them the tools to test for pollution, and raise awareness about the problem. The spectrometer has also been the subject of a public workshop by Jeff Warren and Nadya Peek at Escuelab in collaboration with FabLabLima in Lima, Peru: http://publiclaboratory.org/report/diy-spectrometry-workshop-lima-peru
Online spectral analysisAlong with the physical tool itself, the PLOTS team has also developed an online application which allows anyone to upload a spectrum photographed with a digital camera to the website, and use the online tool to analyze the intensity of the spectrum. The intensity of the spectrum at each wavelength adds a second dimension to the data, allowing for more accurate comparisons to known spectrums. Another tutorial: Resources, Downloads, FAQAccess the online tool (still a prototype) at: http://spectrometer.publiclaboratory.org You can find instructions for making your own spectrometer by Alex McCarthy here: And another prepared by the PLOTS team for our workshop at the Whitney Museum, here: plots-spectrometer-guide-small.pdf Finally, a FAQ with some insights about actually using your spectrometer can be found here: |
Revert | |
| 132 | warren |
October 26, 2011 16:51
| over 13 years ago
[toc] IntroductionWhat we often perceive as a single color actually consists of multiple blended colors- just as green paint can be made from mixing yellow and blue paint. A spectrometer is a device that splits light into the various colors it is actually composed of, which we otherwise cannot distinguish with the naked eye. The particle upshot of this is that by viewing a substance through a spectrometer, one can distinguish the exact mixture of colors, which correspond to specific wavelengths of light, that make up the perceived color of the sample.
The Tool:The PLOTS spectrometer is a DIY tool made from simple materials: cardboard, tape, a CD, and a digital camera. The CD is the key component: the tightly packed grooves in the CD act as a diffraction grating. When light enters a diffraction grating, the different wavelengths of light are bent to different degrees, proportionally to their wavelength, splitting the light into its component wavelengths. There are several versions of the spectrometer:
The Application:It is the ultimate goal for this research to use the PLOTS spectrometer to identify contaminants stemming from fossil fuels in water and air samples. With these capabilities, the spectrometer could be used to identify pollution due to oil spills (Gulf Coast), industrial activity (Gowanus Canal, NY), or natural gas extraction. One group of toxins common to fossil fuel contamination are PAHs, polycyclic aromatic hydrocarbons, which are generally carcinogenic. The PLOTS spectrometer aims to be cheap, easy to manufacture, and easy to use, which could empower people concerned about fossil fuel contamination by giving them the tools to test for pollution, and raise awareness about the problem. The spectrometer has also been the subject of a public workshop by Jeff Warren and Nadya Peek at Escuelab in collaboration with FabLabLima in Lima, Peru: http://publiclaboratory.org/report/diy-spectrometry-workshop-lima-peru
Online spectral analysisAlong with the physical tool itself, the PLOTS team has also developed an online application which allows anyone to upload a spectrum photographed with a digital camera to the website, and use the online tool to analyze the intensity of the spectrum. The intensity of the spectrum at each wavelength adds a second dimension to the data, allowing for more accurate comparisons to known spectrums. Another tutorial: Resources, Downloads, FAQAccess the online tool (still a prototype) at: http://spectrometer.publiclaboratory.org You can find instructions for making your own spectrometer by Alex McCarthy here: And another prepared by the PLOTS team for our workshop at the Whitney Museum, here: plots-spectrometer-guide-small.pdf Finally, a FAQ with some insights about actually using your spectrometer can be found here: |
Revert | |
| 131 | warren |
October 26, 2011 16:51
| over 13 years ago
IntroductionWhat we often perceive as a single color actually consists of multiple blended colors- just as green paint can be made from mixing yellow and blue paint. A spectrometer is a device that splits light into the various colors it is actually composed of, which we otherwise cannot distinguish with the naked eye. The particle upshot of this is that by viewing a substance through a spectrometer, one can distinguish the exact mixture of colors, which correspond to specific wavelengths of light, that make up the perceived color of the sample. [toc hidden:1]
[toc] IntroductionWhat we often perceive as a single color actually consists of multiple blended colors- just as green paint can be made from mixing yellow and blue paint. A spectrometer is a device that splits light into the various colors it is actually composed of, which we otherwise cannot distinguish with the naked eye. The particle upshot of this is that by viewing a substance through a spectrometer, one can distinguish the exact mixture of colors, which correspond to specific wavelengths of light, that make up the perceived color of the sample.
The Tool:The PLOTS spectrometer is a DIY tool made from simple materials: cardboard, tape, a CD, and a digital camera. The CD is the key component: the tightly packed grooves in the CD act as a diffraction grating. When light enters a diffraction grating, the different wavelengths of light are bent to different degrees, proportionally to their wavelength, splitting the light into its component wavelengths. There are several versions of the spectrometer:
The Application:It is the ultimate goal for this research to use the PLOTS spectrometer to identify contaminants stemming from fossil fuels in water and air samples. With these capabilities, the spectrometer could be used to identify pollution due to oil spills (Gulf Coast), industrial activity (Gowanus Canal, NY), or natural gas extraction. One group of toxins common to fossil fuel contamination are PAHs, polycyclic aromatic hydrocarbons, which are generally carcinogenic. The PLOTS spectrometer aims to be cheap, easy to manufacture, and easy to use, which could empower people concerned about fossil fuel contamination by giving them the tools to test for pollution, and raise awareness about the problem. The spectrometer has also been the subject of a public workshop by Jeff Warren and Nadya Peek at Escuelab in collaboration with FabLabLima in Lima, Peru: http://publiclaboratory.org/report/diy-spectrometry-workshop-lima-peru
Online spectral analysisAlong with the physical tool itself, the PLOTS team has also developed an online application which allows anyone to upload a spectrum photographed with a digital camera to the website, and use the online tool to analyze the intensity of the spectrum. The intensity of the spectrum at each wavelength adds a second dimension to the data, allowing for more accurate comparisons to known spectrums. Another tutorial: Resources, Downloads, FAQAccess the online tool (still a prototype) at: http://spectrometer.publiclaboratory.org You can find instructions for making your own spectrometer by Alex McCarthy here: And another prepared by the PLOTS team for our workshop at the Whitney Museum, here: plots-spectrometer-guide-small.pdf Finally, a FAQ with some insights about actually using your spectrometer can be found here: |
Revert | |
| 130 | warren |
May 18, 2011 00:14
| over 13 years ago
[toc] IntroductionWhat we often perceive as a single color actually consists of multiple blended colors- just as green paint can be made from mixing yellow and blue paint. A spectrometer is a device that splits light into the various colors it is actually composed of, which we otherwise cannot distinguish with the naked eye. The particle upshot of this is that by viewing a substance through a spectrometer, one can distinguish the exact mixture of colors, which correspond to specific wavelengths of light, that make up the perceived color of the sample.
The Tool:The PLOTS spectrometer, being developed by Colin Frazer and Jeff Warren, is a low tech spectrometer, made from simple materials: cardboard, tape, a CD, and a digital camera. The CD is the key component: the tightly packed grooves in the CD act as a diffraction grating. When light enters a diffraction grating, the different wavelengths of light are bent to different degrees, proportionally to their wavelength, splitting the light into its component wavelengths.
The Application:It is the ultimate goal for this research to use the PLOTS spectrometer to identify contaminants stemming from fossil fuels in water and air samples. With these capabilities, the spectrometer could be used to identify pollution due to oil spills (Gulf Coast), industrial activity (Gowanus Canal, NY), or natural gas extraction. One group of toxins common to fossil fuel contamination are PAHs, polycyclic aromatic hydrocarbons, which are generally carcinogenic. The PLOTS spectrometer aims to be cheap, easy to manufacture, and easy to use, which could empower people concerned about fossil fuel contamination by giving them the tools to test for pollution, and raise awareness about the problem. The spectrometer has also been the subject of a public workshop by Jeff Warren and Nadya Peek at Escuelab in collaboration with FabLabLima in Lima, Peru: http://publiclaboratory.org/report/diy-spectrometry-workshop-lima-peru
Online spectral analysisAlong with the physical tool itself, the PLOTS team has also developed an online application which allows anyone to upload a spectrum photographed with a digital camera to the website, and use the online tool to analyze the intensity of the spectrum. The intensity of the spectrum at each wavelength adds a second dimension to the data, allowing for more accurate comparisons to known spectrums. Another tutorial: Resources, Downloads, FAQAccess the online tool (still a prototype) at: http://spectrometer.publiclaboratory.org You can find instructions for making your own spectrometer by Alex McCarthy here: And another prepared by the PLOTS team for our workshop at the Whitney Museum, here: plots-spectrometer-guide-small.pdf Finally, a FAQ with some insights about actually using your spectrometer can be found here: |
Revert | |
| 129 | warren |
May 18, 2011 00:13
| over 13 years ago
[toc] IntroductionWhat we often perceive as a single color actually consists of multiple blended colors- just as green paint can be made from mixing yellow and blue paint. A spectrometer is a device that splits light into the various colors it is actually composed of, which we otherwise cannot distinguish with the naked eye. The particle upshot of this is that by viewing a substance through a spectrometer, one can distinguish the exact mixture of colors, which correspond to specific wavelengths of light, that make up the perceived color of the sample.
The Tool:The PLOTS spectrometer, being developed by Colin Frazer and Jeff Warren, is a low tech spectrometer, made from simple materials: cardboard, tape, a CD, and a digital camera. The CD is the key component: the tightly packed grooves in the CD act as a diffraction grating. When light enters a diffraction grating, the different wavelengths of light are bent to different degrees, proportionally to their wavelength, splitting the light into its component wavelengths.
The Application:It is the ultimate goal for this research to use the PLOTS spectrometer to identify contaminants stemming from fossil fuels in water and air samples. With these capabilities, the spectrometer could be used to identify pollution due to oil spills (Gulf Coast), industrial activity (Gowanus Canal, NY), or natural gas extraction. One group of toxins common to fossil fuel contamination are PAHs, polycyclic aromatic hydrocarbons, which are generally carcinogenic. The PLOTS spectrometer aims to be cheap, easy to manufacture, and easy to use, which could empower people concerned about fossil fuel contamination by giving them the tools to test for pollution, and raise awareness about the problem. The spectrometer has also been the subject of a public workshop by Jeff Warren and Nadya Peek at Escuelab in collaboration with FabLabLima in Lima, Peru: http://publiclaboratory.org/report/diy-spectrometry-workshop-lima-peru
Online spectral analysisAlong with the physical tool itself, the PLOTS team has also developed an online application which allows anyone to upload a spectrum photographed with a digital camera to the website, and use the online tool to analyze the intensity of the spectrum. The intensity of the spectrum at each wavelength adds a second dimension to the data, allowing for more accurate comparisons to known spectrums. Another tutorial: Resources, Downloads, FAQAccess the online tool (still a prototype) at: http://spectrometer.publiclaboratory.org You can find instructions for making your own spectrometer by Alex McCarthy here: And another prepared by the PLOTS team for our workshop at the Whitney Museum, here: plots-spectrometer-guide-small.pdf Finally, a FAQ with some insights about actually using your spectrometer can be found here: |
Revert | |
| 128 | warren |
May 18, 2011 00:11
| over 13 years ago
IntroductionWhat we often perceive as a single color actually consists of multiple blended colors- just as green paint can be made from mixing yellow and blue paint. A spectrometer is a device that splits light into the various colors it is actually composed of, which we otherwise cannot distinguish with the naked eye. The particle upshot of this is that by viewing a substance through a spectrometer, one can distinguish the exact mixture of colors, which correspond to specific wavelengths of light, that make up the perceived color of the sample.
The Tool:The PLOTS spectrometer, being developed by Colin Frazer and Jeff Warren, is a low tech spectrometer, made from simple materials: cardboard, tape, a CD, and a digital camera. The CD is the key component: the tightly packed grooves in the CD act as a diffraction grating. When light enters a diffraction grating, the different wavelengths of light are bent to different degrees, proportionally to their wavelength, splitting the light into its component wavelengths.
The Application:It is the ultimate goal for this research to use the PLOTS spectrometer to identify contaminants stemming from fossil fuels in water and air samples. With these capabilities, the spectrometer could be used to identify pollution due to oil spills (Gulf Coast), industrial activity (Gowanus Canal, NY), or natural gas extraction. One group of toxins common to fossil fuel contamination are PAHs, polycyclic aromatic hydrocarbons, which are generally carcinogenic. The PLOTS spectrometer aims to be cheap, easy to manufacture, and easy to use, which could empower people concerned about fossil fuel contamination by giving them the tools to test for pollution, and raise awareness about the problem. The spectrometer has also been the subject of a public workshop by Jeff Warren and Nadya Peek at Escuelab in collaboration with FabLabLima in Lima, Peru: http://publiclaboratory.org/report/diy-spectrometry-workshop-lima-peru
Online spectral analysisAlong with the physical tool itself, the PLOTS team has also developed an online application which allows anyone to upload a spectrum photographed with a digital camera to the website, and use the online tool to analyze the intensity of the spectrum. The intensity of the spectrum at each wavelength adds a second dimension to the data, allowing for more accurate comparisons to known spectrums. Another tutorial: Resources, Downloads, FAQAccess the online tool (still a prototype) at: http://spectrometer.publiclaboratory.org You can find instructions for making your own spectrometer by Alex McCarthy here: And another prepared by the PLOTS team for our workshop at the Whitney Museum, here: plots-spectrometer-guide-small.pdf Finally, a FAQ with some insights about actually using your spectrometer can be found here: |
Revert | |
| 127 | warren |
May 18, 2011 00:10
| over 13 years ago
IntroductionWhat we often perceive as a single color actually consists of multiple blended colors- just as green paint can be made from mixing yellow and blue paint. A spectrometer is a device that splits light into the various colors it is actually composed of, which we otherwise cannot distinguish with the naked eye. The particle upshot of this is that by viewing a substance through a spectrometer, one can distinguish the exact mixture of colors, which correspond to specific wavelengths of light, that make up the perceived color of the sample.
The Tool:The PLOTS spectrometer, being developed by Colin Frazer and Jeff Warren, is a low tech spectrometer, made from simple materials: cardboard, tape, a CD, and a digital camera. The CD is the key component: the tightly packed grooves in the CD act as a diffraction grating. When light enters a diffraction grating, the different wavelengths of light are bent to different degrees, proportionally to their wavelength, splitting the light into its component wavelengths.
The Application:It is the ultimate goal for this research to use the PLOTS spectrometer to identify contaminants stemming from fossil fuels in water and air samples. With these capabilities, the spectrometer could be used to identify pollution due to oil spills (Gulf Coast), industrial activity (Gowanus Canal, NY), or natural gas extraction. One group of toxins common to fossil fuel contamination are PAHs, polycyclic aromatic hydrocarbons, which are generally carcinogenic. The PLOTS spectrometer aims to be cheap, easy to manufacture, and easy to use, which could empower people concerned about fossil fuel contamination by giving them the tools to test for pollution, and raise awareness about the problem. The spectrometer has also been the subject of a public workshop by Jeff Warren and Nadya Peek at Escuelab in collaboration with FabLabLima in Lima, Peru: http://publiclaboratory.org/report/diy-spectrometry-workshop-lima-peru
Online spectral analysisAlong with the physical tool itself, the PLOTS team has also developed an online application which allows anyone to upload a spectrum photographed with a digital camera to the website, and use the online tool to analyze the intensity of the spectrum. The intensity of the spectrum at each wavelength adds a second dimension to the data, allowing for more accurate comparisons to known spectrums. Another tutorial: Resources, Downloads, FAQAccess the online tool (still a prototype) at: http://spectrometer.publiclaboratory.org You can find instructions for making your own spectrometer by Alex McCarthy here: And another prepared by the PLOTS team for our workshop at the Whitney Museum, here: plots-spectrometer-guide-small.pdf Finally, a FAQ with some insights about actually using your spectrometer can be found here: |
Revert | |
| 126 | warren |
May 18, 2011 00:09
| over 13 years ago
IntroductionWhat we often perceive as a single color actually consists of multiple blended colors- just as green paint can be made from mixing yellow and blue paint. A spectrometer is a device that splits light into the various colors it is actually composed of, which we otherwise cannot distinguish with the naked eye. The particle upshot of this is that by viewing a substance through a spectrometer, one can distinguish the exact mixture of colors, which correspond to specific wavelengths of light, that make up the perceived color of the sample. [toc hidden:1]
[toc] IntroductionWhat we often perceive as a single color actually consists of multiple blended colors- just as green paint can be made from mixing yellow and blue paint. A spectrometer is a device that splits light into the various colors it is actually composed of, which we otherwise cannot distinguish with the naked eye. The particle upshot of this is that by viewing a substance through a spectrometer, one can distinguish the exact mixture of colors, which correspond to specific wavelengths of light, that make up the perceived color of the sample.
The Tool:The PLOTS spectrometer, being developed by Colin Frazer and Jeff Warren, is a low tech spectrometer, made from simple materials: cardboard, tape, a CD, and a digital camera. The CD is the key component: the tightly packed grooves in the CD act as a diffraction grating. When light enters a diffraction grating, the different wavelengths of light are bent to different degrees, proportionally to their wavelength, splitting the light into its component wavelengths.
The Application:It is the ultimate goal for this research to use the PLOTS spectrometer to identify contaminants stemming from fossil fuels in water and air samples. With these capabilities, the spectrometer could be used to identify pollution due to oil spills (Gulf Coast), industrial activity (Gowanus Canal, NY), or natural gas extraction. One group of toxins common to fossil fuel contamination are PAHs, polycyclic aromatic hydrocarbons, which are generally carcinogenic. The PLOTS spectrometer aims to be cheap, easy to manufacture, and easy to use, which could empower people concerned about fossil fuel contamination by giving them the tools to test for pollution, and raise awareness about the problem. The spectrometer has also been the subject of a public workshop by Jeff Warren and Nadya Peek at Escuelab in collaboration with FabLabLima in Lima, Peru: http://publiclaboratory.org/report/diy-spectrometry-workshop-lima-peru
Online spectral analysisAlong with the physical tool itself, the PLOTS team has also developed an online application which allows anyone to upload a spectrum photographed with a digital camera to the website, and use the online tool to analyze the intensity of the spectrum. The intensity of the spectrum at each wavelength adds a second dimension to the data, allowing for more accurate comparisons to known spectrums. Another tutorial: Resources, Downloads, FAQAccess the online tool (still a prototype) at: http://spectrometer.publiclaboratory.org You can find instructions for making your own spectrometer by Alex McCarthy here: And another prepared by the PLOTS team for our workshop at the Whitney Museum, here: plots-spectrometer-guide-small.pdf Finally, a FAQ with some insights about actually using your spectrometer can be found here: |
Revert | |
| 125 | warren |
May 18, 2011 00:04
| over 13 years ago
[toc] IntroductionWhat we often perceive as a single color actually consists of multiple blended colors- just as green paint can be made from mixing yellow and blue paint. A spectrometer is a device that splits light into the various colors it is actually composed of, which we otherwise cannot distinguish with the naked eye. The particle upshot of this is that by viewing a substance through a spectrometer, one can distinguish the exact mixture of colors, which correspond to specific wavelengths of light, that make up the perceived color of the sample.
The Tool:The PLOTS spectrometer, being developed by Colin Frazer and Jeff Warren, is a low tech spectrometer, made from simple materials: cardboard, tape, a CD, and a digital camera. The CD is the key component: the tightly packed grooves in the CD act as a diffraction grating. When light enters a diffraction grating, the different wavelengths of light are bent to different degrees, proportionally to their wavelength, splitting the light into its component wavelengths.
The Application:It is the ultimate goal for this research to use the PLOTS spectrometer to identify contaminants stemming from fossil fuels in water and air samples. With these capabilities, the spectrometer could be used to identify pollution due to oil spills (Gulf Coast), industrial activity (Gowanus Canal, NY), or natural gas extraction. One group of toxins common to fossil fuel contamination are PAHs, polycyclic aromatic hydrocarbons, which are generally carcinogenic. The PLOTS spectrometer aims to be cheap, easy to manufacture, and easy to use, which could empower people concerned about fossil fuel contamination by giving them the tools to test for pollution, and raise awareness about the problem. The spectrometer has also been the subject of a public workshop by Jeff Warren and Nadya Peek at Escuelab in collaboration with FabLabLima in Lima, Peru: http://publiclaboratory.org/report/diy-spectrometry-workshop-lima-peru
Online spectral analysisAlong with the physical tool itself, the PLOTS team has also developed an online application which allows anyone to upload a spectrum photographed with a digital camera to the website, and use the online tool to analyze the intensity of the spectrum. The intensity of the spectrum at each wavelength adds a second dimension to the data, allowing for more accurate comparisons to known spectrums. Another tutorial: Resources, Downloads, FAQAccess the online tool (still a prototype) at: http://spectrometer.publiclaboratory.org You can find instructions for making your own spectrometer by Alex McCarthy here: And another prepared by the PLOTS team for our workshop at the Whitney Museum, here: plots-spectrometer-guide-small.pdf Finally, a FAQ with some insights about actually using your spectrometer can be found here: |
Revert | |
| 124 | warren |
May 18, 2011 00:02
| over 13 years ago
[toc] IntroductionWhat we often perceive as a single color actually consists of multiple blended colors- just as green paint can be made from mixing yellow and blue paint. A spectrometer is a device that splits light into the various colors it is actually composed of, which we otherwise cannot distinguish with the naked eye. The particle upshot of this is that by viewing a substance through a spectrometer, one can distinguish the exact mixture of colors, which correspond to specific wavelengths of light, that make up the perceived color of the sample.
The Tool:The PLOTS spectrometer, being developed by Colin Frazer and Jeff Warren, is a low tech spectrometer, made from simple materials: cardboard, tape, a CD, and a digital camera. The CD is the key component: the tightly packed grooves in the CD act as a diffraction grating. When light enters a diffraction grating, the different wavelengths of light are bent to different degrees, proportionally to their wavelength, splitting the light into its component wavelengths.
The Application:It is the ultimate goal for this research to use the PLOTS spectrometer to identify contaminants stemming from fossil fuels in water and air samples. With these capabilities, the spectrometer could be used to identify pollution due to oil spills (Gulf Coast), industrial activity (Gowanus Canal, NY), or natural gas extraction. One group of toxins common to fossil fuel contamination are PAHs, polycyclic aromatic hydrocarbons, which are generally carcinogenic. The PLOTS spectrometer aims to be cheap, easy to manufacture, and easy to use, which could empower people concerned about fossil fuel contamination by giving them the tools to test for pollution, and raise awareness about the problem. The spectrometer has also been the subject of a public workshop by Jeff Warren and Nadya Peek at Escuelab in collaboration with FabLabLima in Lima, Peru: http://publiclaboratory.org/report/diy-spectrometry-workshop-lima-peru
Online spectral analysisAlong with the physical tool itself, the PLOTS team has also developed an online application which allows anyone to upload a spectrum photographed with a digital camera to the website, and use the online tool to analyze the intensity of the spectrum. The intensity of the spectrum at each wavelength adds a second dimension to the data, allowing for more accurate comparisons to known spectrums. Another tutorial: Resources, Downloads, FAQAccess the online tool (still a prototype) at: http://spectrometer.publiclaboratory.org You can find instructions for making your own spectrometer by Alex McCarthy here: And another prepared by the PLOTS team for our workshop at the Whitney Museum, here: plots-spectrometer-guide-small.pdf Finally, a FAQ with some insights about actually using your spectrometer can be found here: |
Revert | |
| 123 | warren |
May 17, 2011 23:37
| over 13 years ago
[toc] IntroductionWhat we often perceive as a single color actually consists of multiple blended colors- just as green paint can be made from mixing yellow and blue paint. A spectrometer is a device that splits light into the various colors it is actually composed of, which we otherwise cannot distinguish with the naked eye. The particle upshot of this is that by viewing a substance through a spectrometer, one can distinguish the exact mixture of colors, which correspond to specific wavelengths of light, that make up the perceived color of the sample.
The Tool:The PLOTS spectrometer, being developed by Colin Frazer and Jeff Warren, is a low tech spectrometer, made from simple materials: cardboard, tape, a CD, and a digital camera. The CD is the key component: the tightly packed grooves in the CD act as a diffraction grating. When light enters a diffraction grating, the different wavelengths of light are bent to different degrees, proportionally to their wavelength, splitting the light into its component wavelengths.
The Application:It is the ultimate goal for this research to use the PLOTS spectrometer to identify contaminants stemming from fossil fuels in water and air samples. With these capabilities, the spectrometer could be used to identify pollution due to oil spills (Gulf Coast), industrial activity (Gowanus Canal, NY), or natural gas extraction. One group of toxins common to fossil fuel contamination are PAHs, polycyclic aromatic hydrocarbons, which are generally carcinogenic. The PLOTS spectrometer aims to be cheap, easy to manufacture, and easy to use, which could empower people concerned about fossil fuel contamination by giving them the tools to test for pollution, and raise awareness about the problem. The spectrometer has also been the subject of a public workshop by Jeff Warren and Nadya Peek at Escuelab in collaboration with FabLabLima in Lima, Peru: http://publiclaboratory.org/report/diy-spectrometry-workshop-lima-peru
Online spectral analysisAlong with the physical tool itself, the PLOTS team has also developed an online application which allows anyone to upload a spectrum photographed with a digital camera to the website, and use the online tool to analyze the intensity of the spectrum. The intensity of the spectrum at each wavelength adds a second dimension to the data, allowing for more accurate comparisons to known spectrums. Another tutorial: Resources, Downloads, FAQAccess the online tool (still a prototype) at: http://spectrometer.publiclaboratory.org You can find instructions for making your own spectrometer by Alex McCarthy here: And another prepared by the PLOTS team for our workshop at the Whitney Museum, here: plots-spectrometer-guide-small.pdf Finally, a FAQ with some insights about actually using your spectrometer can be found here: |
Revert | |
| 122 | warren |
May 17, 2011 23:35
| over 13 years ago
IntroductionWhat we often perceive as a single color actually consists of multiple blended colors- just as green paint can be made from mixing yellow and blue paint. A spectrometer is a device that splits light into the various colors it is actually composed of, which we otherwise cannot distinguish with the naked eye. The particle upshot of this is that by viewing a substance through a spectrometer, one can distinguish the exact mixture of colors, which correspond to specific wavelengths of light, that make up the perceived color of the sample.
The Tool:The PLOTS spectrometer, being developed by Colin Frazer and Jeff Warren, is a low tech spectrometer, made from simple materials: cardboard, tape, a CD, and a digital camera. The CD is the key component: the tightly packed grooves in the CD act as a diffraction grating. When light enters a diffraction grating, the different wavelengths of light are bent to different degrees, proportionally to their wavelength, splitting the light into its component wavelengths.
The Application:It is the ultimate goal for this research to use the PLOTS spectrometer to identify contaminants stemming from fossil fuels in water and air samples. With these capabilities, the spectrometer could be used to identify pollution due to oil spills (Gulf Coast), industrial activity (Gowanus Canal, NY), or natural gas extraction. One group of toxins common to fossil fuel contamination are PAHs, polycyclic aromatic hydrocarbons, which are generally carcinogenic. The PLOTS spectrometer aims to be cheap, easy to manufacture, and easy to use, which could empower people concerned about fossil fuel contamination by giving them the tools to test for pollution, and raise awareness about the problem. The spectrometer has also been the subject of a public workshop by Jeff Warren and Nadya Peek at Escuelab in collaboration with FabLabLima in Lima, Peru: http://publiclaboratory.org/report/diy-spectrometry-workshop-lima-peru
Online spectral analysisAlong with the physical tool itself, the PLOTS team has also developed an online application which allows anyone to upload a spectrum photographed with a digital camera to the website, and use the online tool to analyze the intensity of the spectrum. The intensity of the spectrum at each wavelength adds a second dimension to the data, allowing for more accurate comparisons to known spectrums. Another tutorial: Resources, Downloads, FAQAccess the online tool (still a prototype) at: http://spectrometer.publiclaboratory.org You can find instructions for making your own spectrometer by Alex McCarthy here: And another prepared by the PLOTS team for our workshop at the Whitney Museum, here: plots-spectrometer-guide-small.pdf Finally, a FAQ with some insights about actually using your spectrometer can be found here: |
Revert | |
| 121 | warren |
May 17, 2011 23:32
| over 13 years ago
IntroductionWhat we often perceive as a single color actually consists of multiple blended colors- just as green paint can be made from mixing yellow and blue paint. A spectrometer is a device that splits light into the various colors it is actually composed of, which we otherwise cannot distinguish with the naked eye. The particle upshot of this is that by viewing a substance through a spectrometer, one can distinguish the exact mixture of colors, which correspond to specific wavelengths of light, that make up the perceived color of the sample.
The Tool:The PLOTS spectrometer, being developed by Colin Frazer and Jeff Warren, is a low tech spectrometer, made from simple materials: cardboard, tape, a CD, and a digital camera. The CD is the key component: the tightly packed grooves in the CD act as a diffraction grating. When light enters a diffraction grating, the different wavelengths of light are bent to different degrees, proportionally to their wavelength, splitting the light into its component wavelengths.
The Application:It is the ultimate goal for this research to use the PLOTS spectrometer to identify contaminants stemming from fossil fuels in water and air samples. With these capabilities, the spectrometer could be used to identify pollution due to oil spills (Gulf Coast), industrial activity (Gowanus Canal, NY), or natural gas extraction. One group of toxins common to fossil fuel contamination are PAHs, polycyclic aromatic hydrocarbons, which are generally carcinogenic. The PLOTS spectrometer aims to be cheap, easy to manufacture, and easy to use, which could empower people concerned about fossil fuel contamination by giving them the tools to test for pollution, and raise awareness about the problem. The spectrometer has also been the subject of a public workshop by Jeff Warren and Nadya Peek at Escuelab in collaboration with FabLabLima in Lima, Peru: http://publiclaboratory.org/report/diy-spectrometry-workshop-lima-peru
Online spectral analysisAlong with the physical tool itself, the PLOTS team has also developed an online application which allows anyone to upload a spectrum photographed with a digital camera to the website, and use the online tool to analyze the intensity of the spectrum. The intensity of the spectrum at each wavelength adds a second dimension to the data, allowing for more accurate comparisons to known spectrums. Another tutorial: Access the online tool (still a prototype) at: http://spectrometer.publiclaboratory.org You can find instructions for making your own spectrometer by Alex McCarthy here: And another prepared by the PLOTS team for our workshop at the Whitney Museum, here: plots-spectrometer-guide-small.pdf Finally, a FAQ with some insights about actually using your spectrometer can be found here. |
Revert | |
| 120 | Alex-McCarthy |
May 05, 2011 15:55
| almost 14 years ago
IntroductionWhat we often perceive as a single color actually consists of multiple blended colors- just as green paint can be made from mixing yellow and blue paint. A spectrometer is a device that splits light into the various colors it is actually composed of, which we otherwise cannot distinguish with the naked eye.
The particle upshot of this is that by viewing a substance through a spectrometer, one can distinguish the exact mixture of colors, which correspond to specific wavelengths of light, that make up the perceived color of the sample.
The Tool:The PLOTS spectrometer, being developed by Colin Frazer and Jeff Warren, is a low tech spectrometer, made from simple materials: cardboard, tape, a CD, and a digital camera. The CD is the key component: the tightly packed grooves in the CD act as a diffraction grating. When light enters a diffraction grating, the different wavelengths of light are bent to different degrees, proportionally to their wavelength, splitting the light into its component wavelengths.
The Application:It is the ultimate goal for this research to use the PLOTS spectrometer to identify contaminants stemming from fossil fuels in water and air samples. With these capabilities, the spectrometer could be used to identify pollution due to oil spills (Gulf Coast), industrial activity (Gowanus Canal, NY), or natural gas extraction. One group of toxins common to fossil fuel contamination are PAHs, polycyclic aromatic hydrocarbons, which are generally carcinogenic. The PLOTS spectrometer aims to be cheap, easy to manufacture, and easy to use, which could empower people concerned about fossil fuel contamination by giving them the tools to test for pollution, and raise awareness about the problem. The spectrometer has also been the subject of a public workshop by Jeff Warren and Nadya Peek at Escuelab in collaboration with FabLabLima in Lima, Peru: http://publiclaboratory.org/report/diy-spectrometry-workshop-lima-peru
Analysis of Spectrum:Along with the physical tool itself, the PLOTS team has also developed an online application which allows anyone to upload a spectrum photographed with a digital camera to the website, and use the online tool to analyze the intensity of the spectrum. The intensity of the spectrum at each wavelength adds a second dimension to the data, allowing for more accurate comparisons to known spectrums. another tutorial: http://spectrometer.publiclaboratory.org Instructions for making your own spectrometer: here |
Revert | |
| 119 | Alex-McCarthy |
May 04, 2011 20:29
| almost 14 years ago
IntroductionWhat we often perceive as a single color actually consists of multiple blended colors- just as green paint can be made from mixing yellow and blue paint. A spectrometer is a device that splits light into the various colors it is actually composed of, which we otherwise cannot distinguish with the naked eye.
The particle upshot of this is that by viewing a substance through a spectrometer, one can distinguish the exact mixture of colors, which correspond to specific wavelengths of light, that make up the perceived color of the sample.
The Tool:The PLOTS spectrometer, being developed by Colin Frazer and Jeff Warren, is a low tech spectrometer, made from simple materials: cardboard, tape, a CD, and a digital camera. The CD is the key component: the tightly packed grooves in the CD act as a diffraction grating. When light enters a diffraction grating, the different wavelengths of light are bent to different degrees, proportionally to their wavelength, splitting the light into its component wavelengths.
The Application:It is the ultimate goal for this research to use the PLOTS spectrometer to identify contaminants stemming from fossil fuels in water and air samples. With these capabilities, the spectrometer could be used to identify pollution due to oil spills (Gulf Coast), industrial activity (Gowanus Canal, NY), or natural gas extraction. One group of toxins common to fossil fuel contamination are PAHs, polycyclic aromatic hydrocarbons, which are generally carcinogenic. The PLOTS spectrometer aims to be cheap, easy to manufacture, and easy to use, which could empower people concerned about fossil fuel contamination by giving them the tools to test for pollution, and raise awareness about the problem. The spectrometer has also been the subject of a public workshop by Jeff Warren and Nadya Peek at Escuelab in collaboration with FabLabLima in Lima, Peru: http://publiclaboratory.org/report/diy-spectrometry-workshop-lima-peru
Analysis of Spectrum:Along with the physical tool itself, the PLOTS team has also developed an online application which allows anyone to upload a spectrum photographed with a digital camera to the website, and use the online tool to analyze the intensity of the spectrum. The intensity of the spectrum at each wavelength adds a second dimension to the data, allowing for more accurate comparisons to known spectrums. http://spectrometer.publiclaboratory.org Instructions for making your own spectrometer: here |
Revert |