This page is being migrated to the new spectrometry page -- with new activities and upgrades for ...
Public Lab is an open community which collaboratively develops accessible, open source, Do-It-Yourself technologies for investigating local environmental health and justice issues.
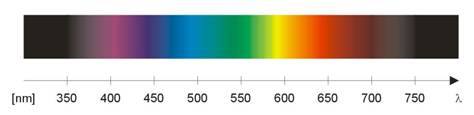
What we often perceive as a single color actually consists of multiple blended colors- just as green paint can be made from mixing yellow and blue paint. A spectrometer is a device that splits light into the various colors it is actually composed of, which we otherwise cannot distinguish with the naked eye.
The particle upshot of this is that by viewing a substance through a spectrometer, one can distinguish the exact mixture of colors, which correspond to specific wavelengths of light, that make up the perceived color of the sample.
The Tool:
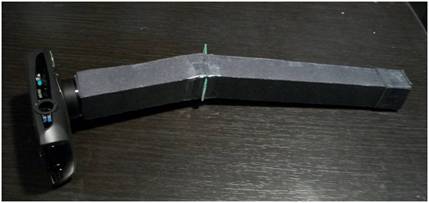
The PLOTS spectrometer, being developed by Colin Frazer and Jeff Warren, is a low tech spectrometer, made from simple materials: cardboard, tape, a CD, and a digital camera. The CD is the key component: the tightly packed grooves in the CD act as a diffraction grating. When light enters a diffraction grating, the different wavelengths of light are bent to different degrees, proportionally to their wavelength, splitting the light into its component wavelengths.
The Application:
It is the ultimate goal for this research to use the PLOTS spectrometer to identify contaminants stemming from fossil fuels in water and air samples. With these capabilities, the spectrometer could be used to identify pollution due to oil spills (Gulf Coast), industrial activity (Gowanus Canal, NY), or natural gas extraction. One group of toxins common to fossil fuel contamination are PAHs, polycyclic aromatic hydrocarbons, which are generally carcinogenic. The PLOTS spectrometer aims to be cheap, easy to manufacture, and easy to use, which could empower people concerned about fossil fuel contamination by giving them the tools to test for pollution, and raise awareness about the problem.
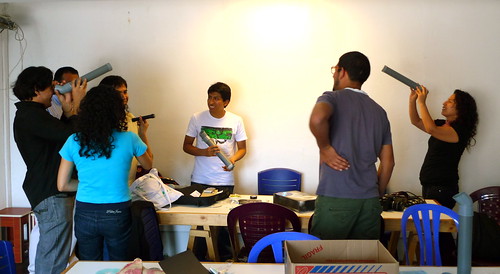
The spectrometer has also been the subject of a public workshop by Jeff Warren and Nadya Peek at Escuelab in collaboration with FabLabLima in Lima, Peru:
Along with the physical tool itself, the PLOTS team has also developed an online application which allows anyone to upload a spectrum photographed with a digital camera to the website, and use the online tool to analyze the intensity of the spectrum. The intensity of the spectrum at each wavelength adds a second dimension to the data, allowing for more accurate comparisons to known spectrums.
http://spectrometer.publiclaboratory.org
Instructions for making your own spectrometer:
here
What we often perceive as a single color actually consists of multiple blended colors- just as green paint can be made from mixing yellow and blue paint. A spectrometer is a device that splits light into the various colors it is actually composed of, which we otherwise cannot distinguish with the naked eye.
The particle upshot of this is that by viewing a substance through a spectrometer, one can distinguish the exact mixture of colors, which correspond to specific wavelengths of light, that make up the perceived color of the sample.
The Tool:
The PLOTS spectrometer, being developed by Colin Frazer and Jeff Warren, is a low tech spectrometer, made from simple materials: cardboard, tape, a CD, and a digital camera. The CD is the key component: the tightly packed grooves in the CD act as a diffraction grating. When light enters a diffraction grating, the different wavelengths of light are bent to different degrees, proportionally to their wavelength, splitting the light into its component wavelengths.
The Application:
It is the ultimate goal for this research to use the PLOTS spectrometer to identify contaminants stemming from fossil fuels in water and air samples. With these capabilities, the spectrometer could be used to identify pollution due to oil spills (Gulf Coast), industrial activity (Gowanus Canal, NY), or natural gas extraction. One group of toxins common to fossil fuel contamination are PAHs, polycyclic aromatic hydrocarbons, which are generally carcinogenic. The PLOTS spectrometer aims to be cheap, easy to manufacture, and easy to use, which could empower people concerned about fossil fuel contamination by giving them the tools to test for pollution, and raise awareness about the problem.
The spectrometer has also been the subject of a public workshop by Jeff Warren and Nadya Peek at Escuelab in collaboration with FabLabLima in Lima, Peru:
Along with the physical tool itself, the PLOTS team has also developed an online application which allows anyone to upload a spectrum photographed with a digital camera to the website, and use the online tool to analyze the intensity of the spectrum. The intensity of the spectrum at each wavelength adds a second dimension to the data, allowing for more accurate comparisons to known spectrums.
http://spectrometer.publiclaboratory.org
Instructions for making your own spectrometer:
here
The PLOTS Spectrometer is a tool Colin Frazer and Jeff Warren have been developing at RISD's Environmental Justice research group. A spectrometer is a tool for identifying the unique patterns of light refracted, reflected or emitted from an object, like a fingerprint. Using spectrometer you can collect that pattern of light and use it to identify what a substance is made of. We hope to use spectrometry to identify harmful gases emitted during the course of oil and gas production. Our spectrometer consists of a cardboard box, a broken CD, and a digital camera. The cardboard box or tube collects the light from an object. The broken CD splits that light into a rainbow like spectrum. The digital camera photographs that spectrum so we can analyze it using our online tools.
Analysis: Interpreting your spectra
We've created an online analysis tool to upload your spectrometer photos for interpretation. All of this is very prototoype-stage, and we haven't yet identified a material based on the spectra it generates.
However, as our first goal, we're interested in identifying PAHs (Poly-Aromatic Hydrocarbons) (which are present at the Gulf Coast and the Gowanus Canal, and benzine, which is amongst the contaminants found at natural gas extraction sites, especially those employing hydraulic fracturing.
http://spectrometer.publiclaboratory.org
The spectrometer has also been the subject of a public workshop by Jeff Warren and Nadya Peek at Escuelab in collaboration with FabLabLima in Lima, Peru:
The PLOTS Spectrometer is a tool Colin Frazer and Jeff Warren have been developing at RISD's Environmental Justice research group. A spectrometer is a tool for identifying the unique patterns of light refracted, reflected or emitted from an object, like a fingerprint. Using spectrometer you can collect that pattern of light and use it to identify what a substance is made of. We hope to use spectrometry to identify harmful gases emitted during the course of oil and gas production. Our spectrometer consists of a cardboard box, a broken CD, and a digital camera. The cardboard box or tube collects the light from an object. The broken CD splits that light into a rainbow like spectrum. The digital camera photographs that spectrum so we can analyze it using our online tools.
We've created an online analysis tool to upload your spectrometer photos for interpretation. All of this is very prototoype-stage, and we haven't yet identified a material based on the spectra it generates.
http://spectrometer.publiclaboratory.org
The spectrometer has also been the subject of a public workshop by Jeff Warren and Nadya Peek at Escuelab in collaboration with FabLabLima in Lima, Peru:
The PLOTS Spectrometer is a tool we've been developing at RISD's Environmental Justice research group with student Colin Frazer. A spectrometer is a tool for identifying the unique patterns of light refracted, reflected or emitted from an object, like a fingerprint. Using spectrometer you can collect that pattern of light and use it to identify what a substance is made of. We hope to use spectrometry to identify harmful gases emitted during the course of oil and gas production. Our spectrometer consists of a cardboard box, a broken CD, and a digital camera. The cardboard box or tube collects the light from an object. The broken CD splits that light into a rainbow like spectrum. The digital camera photographs that spectrum so we can analyze it using our online tools.
We've created an online analysis tool to upload your spectrometer photos for interpretation. All of this is very prototoype-stage, and we haven't yet identified a material based on the spectra it generates.
The PLOTS Spectrometer is a tool we've been developing at RISD's Environmental Justice research group with student Colin Frazer. It consists of a cardboard box, a broken CD, and a digital camera. We're hoping to use it to identify contaminants and produce hyperspectral scans.
We've created an online analysis tool to upload your spectrometer photos for interpretation. All of this is very prototoype-stage, and we haven't yet identified a material based on the spectra it generates.

