Spectrometer
[toc]
Introduction
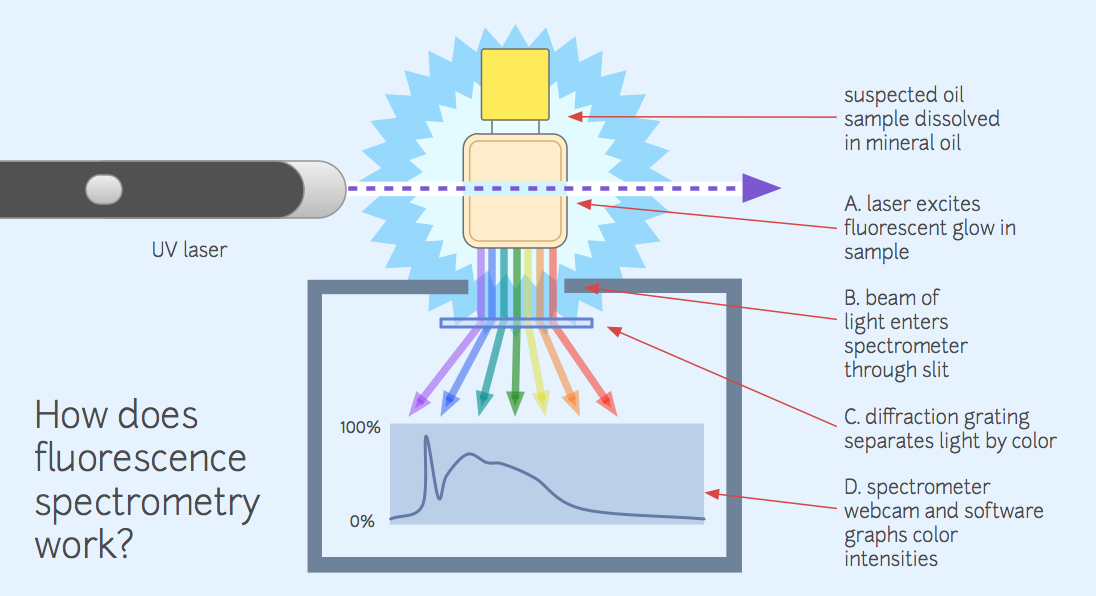
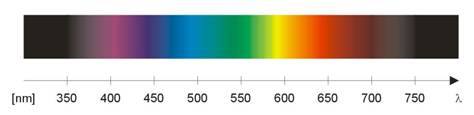
What we often perceive as a single color actually consists of multiple blended colors- just as green paint can be made from mixing yellow and blue paint. A spectrometer is a device that splits light into the various colors it is actually composed of, which we otherwise cannot distinguish with the naked eye. The particle upshot of this is that by viewing a substance through a spectrometer, one can distinguish the exact mixture of colors, which correspond to specific wavelengths of light, that make up the perceived color of the sample.
The Tool:
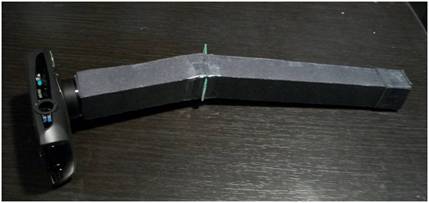
The PLOTS spectrometer, being developed by Colin Frazer and Jeff Warren, is a low tech spectrometer, made from simple materials: cardboard, tape, a CD, and a digital camera. The CD is the key component: the tightly packed grooves in the CD act as a diffraction grating. When light enters a diffraction grating, the different wavelengths of light are bent to different degrees, proportionally to their wavelength, splitting the light into its component wavelengths.
The Application:
It is the ultimate goal for this research to use the PLOTS spectrometer to identify contaminants stemming from fossil fuels in water and air samples. With these capabilities, the spectrometer could be used to identify pollution due to oil spills (Gulf Coast), industrial activity (Gowanus Canal, NY), or natural gas extraction. One group of toxins common to fossil fuel contamination are PAHs, polycyclic aromatic hydrocarbons, which are generally carcinogenic. The PLOTS spectrometer aims to be cheap, easy to manufacture, and easy to use, which could empower people concerned about fossil fuel contamination by giving them the tools to test for pollution, and raise awareness about the problem.
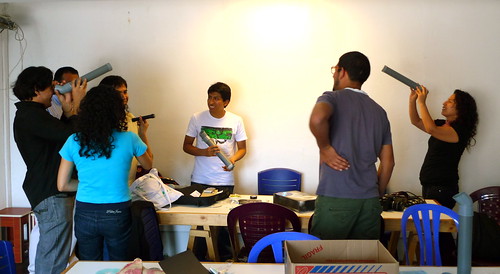
The spectrometer has also been the subject of a public workshop by Jeff Warren and Nadya Peek at Escuelab in collaboration with FabLabLima in Lima, Peru:
http://publiclaboratory.org/report/diy-spectrometry-workshop-lima-peru
Online spectral analysis
Along with the physical tool itself, the PLOTS team has also developed an online application which allows anyone to upload a spectrum photographed with a digital camera to the website, and use the online tool to analyze the intensity of the spectrum. The intensity of the spectrum at each wavelength adds a second dimension to the data, allowing for more accurate comparisons to known spectrums.
Another tutorial:
Resources, Downloads, FAQ
Access the online tool (still a prototype) at: http://spectrometer.publiclaboratory.org
You can find instructions for making your own spectrometer by Alex McCarthy here:
And another prepared by the PLOTS team for our workshop at the Whitney Museum, here:
plots-spectrometer-guide-small.pdf
Finally, a FAQ with some insights about actually using your spectrometer can be found here: