Spectrometer
Purpose
Chemists use expensive tools called spectrometers (there are several kinds) to analyze unknown solid or liquid samples. We are working on a cheap version which we hope to use to identify oil contamination in water and soil, as well as a range of other possible toxins.
Spectrometers can also be used to identify species of plants or crop diseases, assess plumes from smokestacks, and have many other applications.
What's spectrometry?
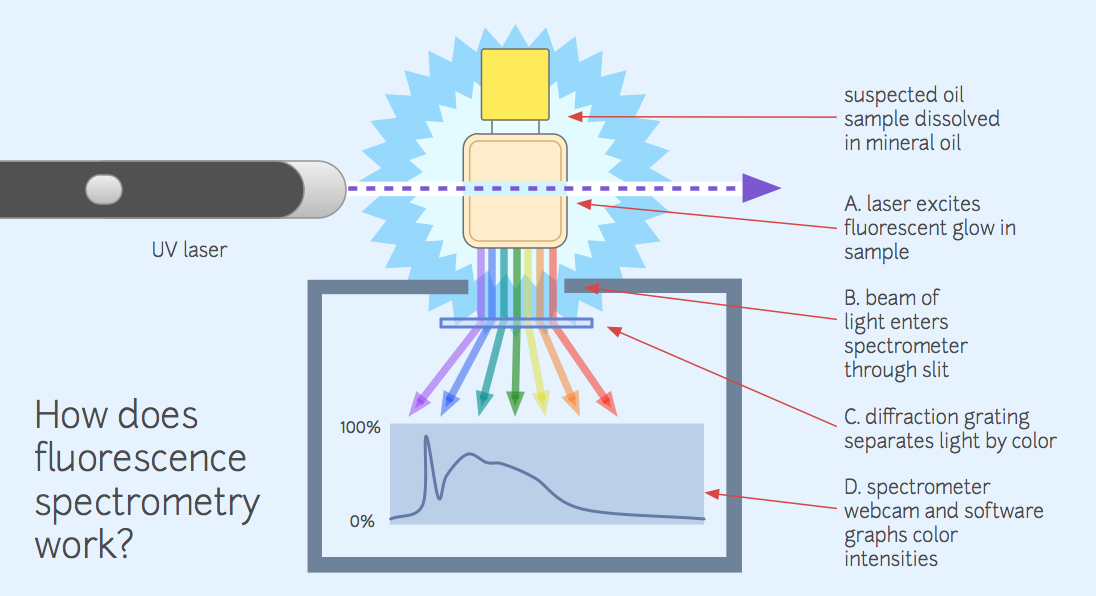
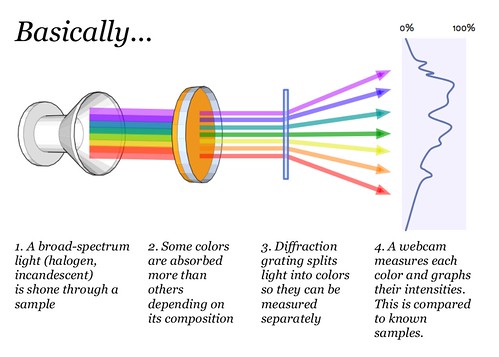
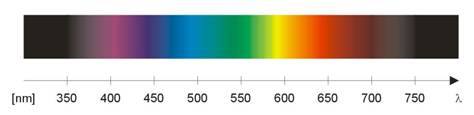
What we perceive as a single color consists of multiple blended colors- just as green paint can be made from mixing yellow and blue paint. A spectrometer is a device that splits light into the various colors it is composed of, which we otherwise cannot distinguish with the naked eye. By viewing a substance through a spectrometer, one can distinguish the exact mixture of colors, which correspond to specific wavelengths of light, that make up the perceived color of the sample.
Make your own inexpensive spectrometer
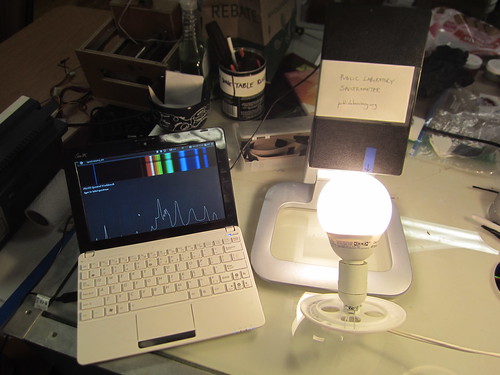
The PLOTS spectrometer is a Do-it-Yourself tool made from simple materials:
- 4 1/8" x 8 3/8" stiff black card paper
- a clean DVD-R
- a webcam
- velcro, dark tape, a box cutter/x-acto knife
The DVD's tightly packed grooves act as a diffraction grating -- basically a prism. When light enters, the different wavelengths of light are bent to different degrees, forming a rainbow -- a spectrum.
Learn how to make one here: Video spectrometer construction
This design is released under the CERN Open Hardware License 1.1 (read agreement here). It features:
- around 400-900 nanometer range, maybe wider
- 5-10 nm spectral resolution
- 20-30 samples per second
- ~ $10 in materials
- < 1 hour construction time
- Mac and Linux compatible, should work on Windows but untested
- open-source software
Usage
One group of toxins common to fossil fuel contamination are PAHs, polycyclic aromatic hydrocarbons, which are generally carcinogenic.
...
Online spectral analysis
Along with the physical tool itself, the PLOTS team has also developed an online application which allows anyone to upload a spectrum photographed with a digital camera to the website, and use the online tool to analyze the intensity of the spectrum. The intensity of the spectrum at each wavelength adds a second dimension to the data, allowing for more accurate comparisons to known spectrums.
Another tutorial:
Resources, Downloads, FAQ
Access the online tool at: https://spectralworkbench.org
Several guides have been made showing you how to make a spectrometer.
Make a Spectrometer - Alex McCarthy
And another prepared by the PLOTS team for our workshop at the Whitney Museum, here:
plots-spectrometer-guide-small.pdf
Finally, a FAQ with some insights about actually using your spectrometer can be found here: