This note proposes a Light Emitting Diode (LED) simulator that would assist in the collection and analysis of normalized difference vegetation index (NDVI) images. A prototype simulator and a NIR/red vs NIR/white light NDVI comparison example is described.
Introduction
The packaging of color filters in Raspberry Pi NoIR cameras, Infragram starter kits and the development of open source image processing software has provided increase access to DIY NDVI remote sensing technology. While these tools are easy to use, NDVI applications are often faced with challenges that frustrate successful NDVI data analysis. These challenges include correct selection of multiple camera and processing settings, variable lighting/atmospheric conditions, changes in vegetation over time, inexperienced users, and images limited by optical distortions. The note proposes a general purpose NDVI light simulator that can be used to test different techniques/camera designs and help reduce the challenges associated with multispectral DIY remote sensing.
Potential NDVI LED simulator applications:
--Demonstration of image collection/processing pipeline before field trials
--Permit real time NDVI measurements for classroom demonstrations
--Provide feedback for optimization of camera or processing features.
--Identify impact of lighting dynamic range on NDVI images.
--Ability to demonstrate NDVI indoors, at night and independent of season
--Consistent color reference with LANDSAT 8 data
--Practice calibration techniques required for NDVI analysis
--Create high resolution NDVI images
NDVI LED simulator design concept:
--Lighting: The lighting approach consists of LED strip lights that mimic LANDSAT 8 spectral properties (see picture below). In particular, LEDs that produce light in band 4 (640-670nm) and band 5 (850-880nm) https://landsat.usgs.gov/spectral-characteristics-viewer. LEDs are also considered safer (cool to the touch) than other infrared light sources.

--Test Materials: A mixture of photographic reference objects mixed with green vegetation samples. The concept is to use well known color reference targets for immediate visible light analysis and conduct additional measurements which would update their NIR (near infrared) spectral characteristics. The goal is to extend the range of commercial products to enable NDVI analysis. In addition, other calibration options could also be included: https://publiclab.org/notes/nedhorning/05-01-2014/improved-diy-nir-camera-calibration
--Software Processing: Processing via Spectral Workbench. https://publiclab.org/wiki/image-sequencer.
Prototype NDVI simulator:
The design consists of a horizontal wooden board that is laced with different wavelength LED strips. The LED strips were selected to match Red/ NIR Landsat spectral bands as well as to permit evaluation of different NDVI camera designs (NRG/NRB). Picture below describes the wooden board mounted over imaging objects (left) and a close up of the LED strips (right). Holes in the center of the board permit a camera to view objects directly below.

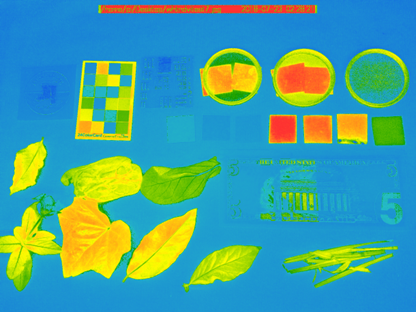
Imaging objects (pictured below) were selected to illustrate a wide range of spatial and spectral properties:
-5 dollar US bill -- NIR counterfeit markings provide example of high NIR reflectivity
-Roscolux color filters - Red (19), Orange (21), Yellow (10), Green (89), Blue (83), Indigo(59), Violet (54). Spectral transmission graphs at http://us.rosco.com/en/mycolor
-Resolution test target
-Vivitar 2,4,8 Neutral Density (ND) filters over green and blue filters -- use to study impact of different light levels on NDVI ratio.
-Green leaf samples

NDVI LED simulator demonstration
Combined with the Public Lab's image-sequencer, the NDVI LED simulator permits rapid evaluation of different NDVI imaging scenarios. Example below is a comparison study of NIR/wht vs NIR/red NDVI images taken with a Raspberry Pi NoIR camera (AUTO settings). The comparison begins by taking a NIR, red and wht picture of the same objects. The picture below shows the NIR/wht light processing steps with different colormaps.

NIR/red NDVI processing is shown below. Two noticeable differences can be observed. The first is that the Raspberry Pi camera lens shading correction is not adjusted for red only lighting, The second is that the colormaps display bright red (purple for fastie) indicating NDVI ratios near 1. My interpretation is that the red scene (and auto camera settings) provides higher red signal levels (creating higher NDVI ratios) that are near the red peak in colormap displays. Future tests should consider reducing the red gain which might also help correct the lens shading problem.

Final thoughts:
The prototype NDVI LED simulator can be adapted for different imaging systems as needed. For example, other Landsat 8 bands could be matched or UV LEDS could be added.
A major limitation is the lack of (low cost) calibrated NIR objects. It would be great if we could pick a few targets and crowd source measurements.
Please provide any comments on how to improve the prototype or make recommendations on alternative designs.
Simulators are like training wheels and should not be considered a replacement for NDVI outdoor collection (ideally with calibrated reference targets).
Related Posts/Info:
Calibration discussion: https://publiclab.org/notes/nedhorning/06-30-2015/automating-ndvi-calibration
Colormap discussion https://publiclab.org/notes/cfastie/08-26-2014/new-ndvi-colormap
Red/blue filter discussion
https://publiclab.org/wiki/infragram-filters
Color balance discussion
https://publiclab.org/wiki/infrablue-white-balance
Raspberry Pi NoIR imaging
CameraTrax spectrum card (similar to Macbeth Chart) (paper below provides some reflectance data)
MaggPi,
This a really promising approach.
Do you have any information on the proportion of red light to NIR light produced by your LED combinations? Ideally you would want to know the radiance in each band (how much energy is being delivered to the test surfaces). That will require special equipment, so you can substitute a measure of brightness. The goal would be to adjust the brightness of each color band (red and NIR) to match the proportion in sunlight (or sky light).
Do you have any information on the relative sensitivity of the camera sensor to red light versus NIR light? Even if you adjust the incoming light to match the red:NIR ratio in sunlight, if the camera is less sensitive to NIR (which it is) then your photographs might not record what you need them to record, which is how much of each color band (red and NIR) is being reflected from the test surfaces.
To review, traditional NDVI images are produced under sunlight with radiometers which measure how much energy is in the light (in red and NIR bands) reflected from foliage.
Answering the two questions above is a challenge. If you don’t know how sensitive your camera is to red versus NIR light, then you can’t use that camera to measure the relative brightness of red and NIR in the incoming light (or the reflected light).
A solution which has been proposed is to acquire objects with surfaces of known reflectivity in the red and NIR bands of interest. Ideally each of these surfaces would reflect the same proportion of the red and NIR bands because this will make your calculations easier. But as long as you know how reflective the surface is in both bands you can work with it. By including these surfaces in your photos you can begin to learn how much your lighting and measurement systems are altering the red:NIR ratio.
Unfortunately, you have two unknown variables. Both your incoming light (LEDs) and your camera sensitivity are unknown. So you will have to devise some clever protocol for solving for two unknowns.
Calibration targets of known reflectivity are commonly used for NDVI photography done outside where sunlight is illuminating the scene and is not an unknown. Ideally we want a camera which will record the actual brightness for both red and NIR reflected from that calibration target. The cameras we use typically underreport NIR because the cameras are less sensitive to NIR. Because we know the expected red:NIR ratio after reflection from the target, we can use the difference between actual reflected red and NIR to adjust the red:NIR ratio in all other pixels in the photo.
Ned Horning’s Photo Monitoring plugin for Fiji allows information from calibration targets to be used to adjust (calibrate) the photos before they are used to compute NDVI. I tried to explain how this works in this note (https://publiclab.org/notes/cfastie/05-01-2016/calibration-cogitation) which assumes that the photos were taken outside under sunlight.
A next step might be to characterize some of the objects in your test photos so you know how much of the incoming red and NIR are being reflected from them. You might already have some information about this for some of the objects you included (e.g., Rosco filters). But this will not solve the two unknown issue. The tool of choice to characterize the spectral reflectance of a surface is a spectrometer. The Public Lab type spectrometers are probably not sufficiently sensitive in the NIR to work well for this, and are also not well-suited for intensity measurements without the type of gain correction that Dave Stoft has done (https://publiclab.org/notes/stoft/02-25-2015/plab-spectrometer-gain-correction).
You have not explained what your two figures represent. Each figure has seven images, and they apparently represent stages in the image sequencer process. It might help to have a caption which explained that there are two input photographs (left) and two images which result from processing (center), and then three images which result from other processing of the NDVI image (right). Some of the things I do not know about these figures are
1 What is red blend?
2 Why are there no arrows connecting the two input photos and the NDVI image?
3 What color channels (RGB) were used to make an NDVI image from the two photos?
4 What is the default colormap?
5 What is the stretched colormap?
There are some things I do know about these figures that many other readers might not know including
1) What is the fastie colormap?
2) How is NDVI derived from the input photos?
My interpretation of the very high (close to 1.0) NDVI values in the red-NIR result is that the red photo was very dark (underexposed?) so the DNs in the red (and also green and blue) channels for the leaves and ND filters were close to zero. If the value for red is zero, then (NIR-red)/(NIR+red) evaluates to 1.0 regardless of the NIR value. The photos (or channels) used for both NIR and red must be well exposed but both must also be exposed with the same settings for f/stop, shutter speed, ISO, and gain.
Chris
Is this a question? Click here to post it to the Questions page.
Reply to this comment...
Log in to comment
Thanks again for your comments. Much of this is a work in progress but here is an update:
Do you have any information on the proportion of red light to NIR light produced by your LED combinations? The slide below provides typical LED spectra. I would say the IR to VIS crossover is low but note I have not measured the LEDS to make sure.
Ideally you would want to know the radiance in each band (how much energy is being delivered to the test surfaces). That will require special equipment, so you can substitute a measure of brightness. The goal would be to adjust the brightness of each color band (red and NIR) to match the proportion in sunlight (or sky light). I do not have radiance values. One option to consider is a light detector located with the objects. The Adafruit detector below looks like it may provide a ratio reference but there may be something better. It’s only 6 dollars!
https://learn.adafruit.com/adafruit-tsl2591/overview. https://cdn-shop.adafruit.com/datasheets/TSL25911_Datasheet_EN_v1.pdf
Do you have any information on the relative sensitivity of the camera sensor to red light versus NIR light? Yes, see below for Raspberry PI v2 NoiR response, I assume this is a typical for other digital cameras. Example spectral output for the 660, 850, and 940nm LEDS are also added to the response curve. The article below has additional info:
https://www.spiedigitallibrary.org/journals/journal-of-electronic-imaging/volume-26/issue-01/013014/Laying-the-foundation-to-use-Raspberry-Pi-3-V2-camera/10.1117/1.JEI.26.1.013014.full?SSO=1
Even if you adjust the incoming light ……. Looking at the graphs it seems the sensitivity difference is 3 (vis) to ir (1)at 850nm. There may be several ways to compensate for this: more/less LEDS, exposure control, filters, etc.
A solution which has been proposed is to acquire objects with……. Adjusting the gain settings is some thing I would like to try.
A next step might be to characterize some of the objects in your test photos so you know how much of the incoming red and NIR are being reflected from them. You might already have some information about this for some of the objects you included (e.g., Rosco filters). But this will not solve the two unknown issue. The tool of choice to characterize the spectral reflectance of a surface is a spectrometer. The Public Lab type spectrometers are probably not sufficiently sensitive in the NIR to work well for this, and are also not well-suited for intensity measurements without the type of gain correction that Dave Stoft has done (https://publiclab.org/notes/stoft/02-25-2015/plab-spectrometer-gain-correction).
Its a problem that photographic color references are not calibrated for the IR. Believe this is something the could be done in the future. In the meantime, you can get learn a lot by comparing objects to leaves, etc.
Unfortunately, you have two unknown variables. Both your incoming light (LEDs) and your camera sensitivity are unknown. So you will have to devise some clever protocol for solving for two unknowns.
It may be unrealistic to expect a (low cost) simulator to provide absolute (with respect to LANDSAT) NDVI calibration. However, it may be useful for relative comparison of different systems.
I have tried using outdoor NDVI collection to scale the light levels for the simulator. The two videos show NDVI images from outdoors (with sunlight) and with the LED simulator. Both videos use a Raspberry Pi NoIR camera and computer vision software to collect NDVI scenes at video frame rates. I can adjust the Vis/IR lighting in the simulator to mimic the outdoor results. Picture below provides additional details but it is probably worth a separate post.
Outdoor B/G/R/NDVI video: https://www.youtube.com/watch?v=YMvLjnNLmRA&t=28s
LED simulator B/G/R/NDVI video: https://www.youtube.com/watch?v=Dg_KQmfBRPg
It’s also possible to compare a 2 picture (NIR/WHT) NDVI image using the LED simulator and image sequencer. In this case the ‘stretched’ colormap image seems to be close to the computer vision NDVI LED simulator video. (Note the pictures show I need to balance out the white light intensity.) Need to learn more about how image sequencer works and it may be possible to get a closer match.
You have not explained what your two figures represent. Each figure has seven images, and they apparently represent stages in the image sequencer process. It might help to have a caption which explained that there are two input photographs (left) and two images which result from processing (center), and then three images which result from other processing of the NDVI image (right). Some of the things I do not know about these figures are
Sorry for the confusion!, I did not reference the processing sequence that was described in this post: https://publiclab.org/notes/warren/05-30-2018/use-image-sequencer-for-ndvi-plant-analysis-with-2-images
I think we are in a transition period between https://infragram.org/ and https://publiclab.org/wiki/image-sequencer. Image sequencer has more processing options and it may be necessary to describe the processing steps in more detail.
1 What is red blend? Blends the red channel from image 1(infrared) and the green and blue channels of image 2 (visible RGB).
2 Why are there no arrows connecting the two input photos and the NDVI image? The slide refers to image sequencer processing steps. The image sequencer has NDVI as a single step and performs the (r-b)/(r+b) operation(from the red blend).
3 What color channels (RGB) were used to make an NDVI image from the two photos?
See #1 and 2
4 What is the default colormap? Not sure. I know there are still pushing out the documentation 5 What is the stretched colormap? Not sure, I believe it's ‘JET’ since it seems to match results from the computer program.
1) What is the fastie colormap? The fastie colormap is one of the few colormaps specifically designed for NDVI. Thanks for this ! More info at: https://publiclab.org/notes/cfastie/08-26-2014/new-ndvi-colormap.. Ideally, image sequencer will add a colormap overlay option so we can easily reference the NDVI scale. I may add this to the NDVI computer program.
2) How is NDVI derived from the input photos? The image sequencer website implies it’s a basic (r-b)/(r+b) operation. It’s not clear if other processing steps are also included in the sequence step and this would be good documentation to add.
My interpretation of the very high (close to 1.0) NDVI values in the red-NIR result is that the red photo was very dark (underexposed?) so the DNs in the red (and also green and blue) channels for the leaves and ND filters were close to zero. If the value for red is zero, then (NIR-red)/(NIR+red) evaluates to 1.0 regardless of the NIR value. The photos (or channels) used for both NIR and red must be well exposed but both must also be exposed with the same settings for f/stop, shutter speed, ISO, and gain.
This may be OBE since I am using new light levels. I may do this comparison again once I figure out how to do flat field correction.
@warren, @icarito, @amirberAgain, @cfastie
Is this a question? Click here to post it to the Questions page.
Reply to this comment...
Log in to comment
oooh, i very impress by your knowleage, i am arriving NOW to PublicLab, and I find your posts, very interesting, because it is something that i trying to do for some time, and I think it is complex to achive reproductibility of results. By the way, I will leave just a message. I'm working on a Xubuntu 18.04 Labtop, Gnu Octave, Fiji-ImageJ and will try to install Jupyter Notebook , all this to process stream imagens from RPI 3b+, to work on something I hope, Similar to your work, like automatic capture time-lapse imagens streammed to the laptop wireless. This means, Scripting on Fiji-ImageJ. Other way is to script an process on line, working with PublicLab spectral resources on line. Something like that. Tks. I will return.jotasbe.
Reply to this comment...
Log in to comment