Overview
The goal of this project was to make a conductivity and temperature (CT) sensor that gives accurate and repeatable measurements while still being affordable. In the quest for that goal, a simple circuit board and probe were designed. The design applies an AC square wave across a voltage divider, where one of the resistors is a know value and the second is determined by the resistance of the solution being measured.
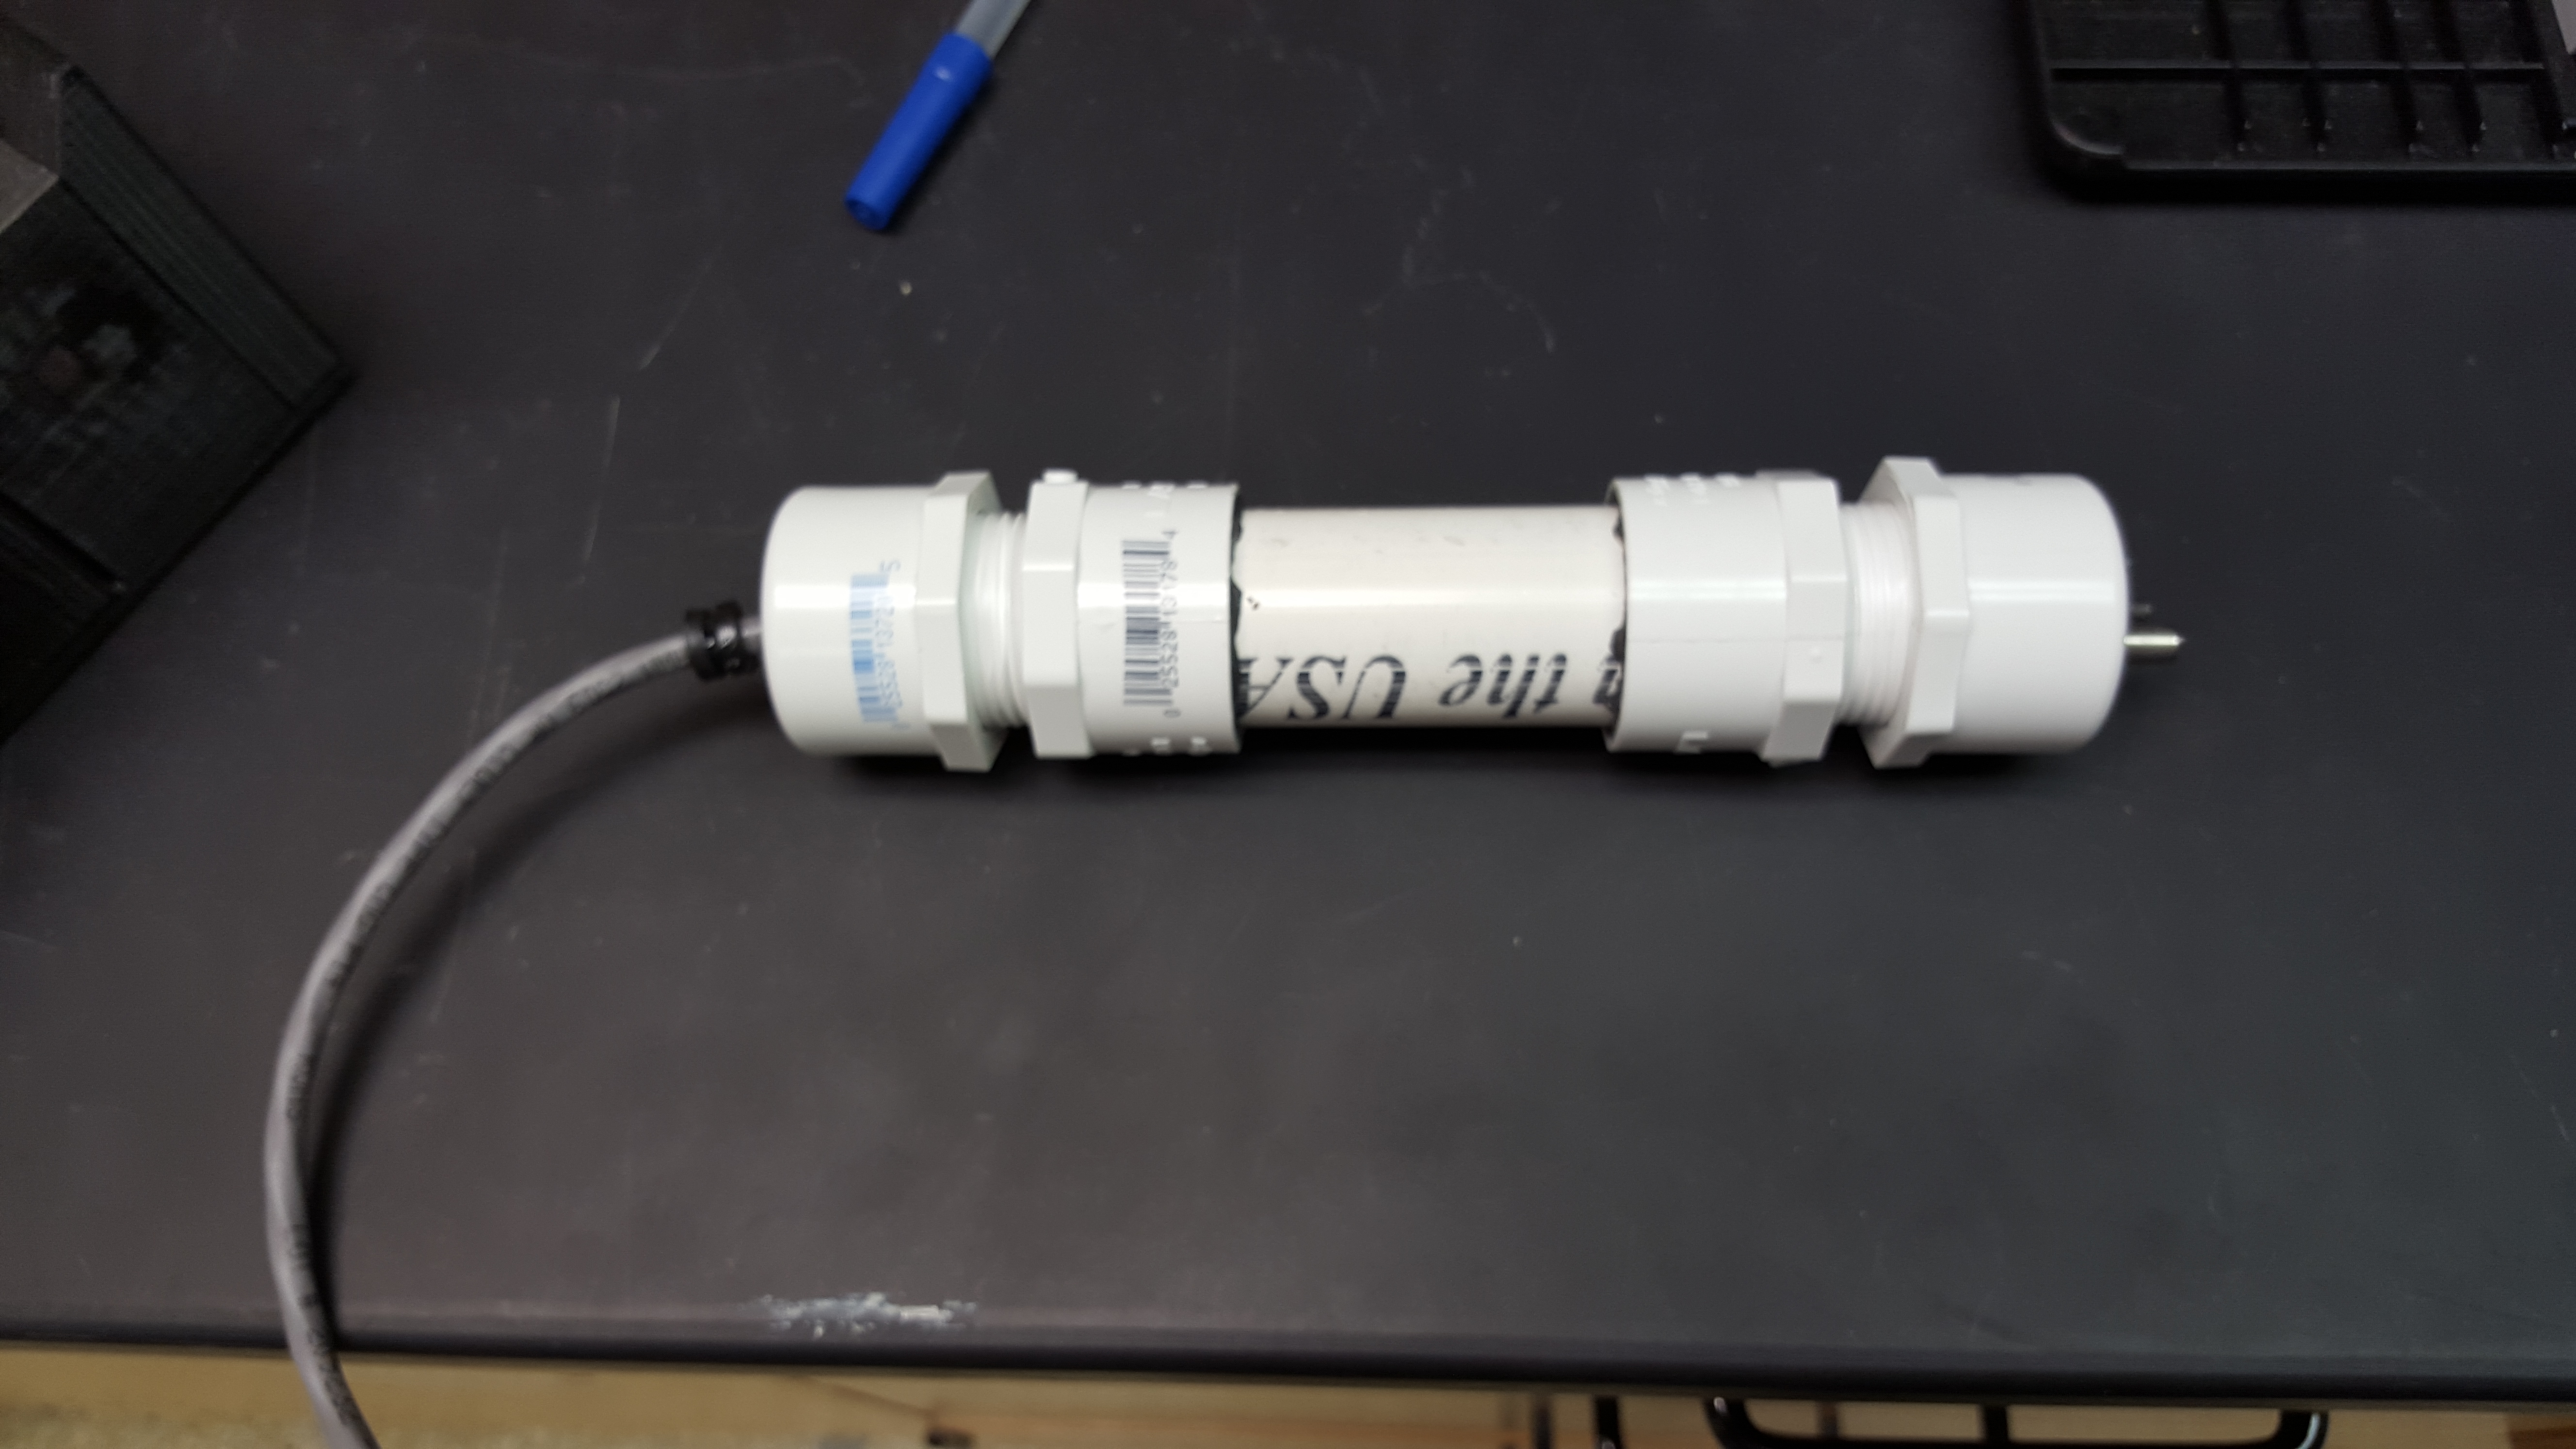
Electrodes and Thermistor

The body of the conductivity and temperature (CT) sensor was made from a 1” PVC tube which was cut to about six inches long. The end caps where the electrodes, thermostat, and data cable come through were made by drilling holes in common PVC fittings found at the local hardware store.


The conductivity electrodes were made from two pieces of graphite, each about one inch long. Wires were attached to the graphite electrodes by wrapping them a few times around the graphite and using heat shrink to hold them in place. Heat shrink was also applied to the entire surface of the graphite except for the last couple millimeters which will be exposed to solution. I found that its important that the heat shrink provide insulation between the graphite and the PVC end caps, otherwise noisy and unstable readings would result. The thermistor was also wrapped in heat shrink except for a half inch portion that’s exposed to the test solution. I believe this is unnecessary to use heat shrink on the thermistor, but I drilled my hole to large and the added width from the heat shrink made for a better fit…
After the graphite electrodes and thermistor were wrapped in heat shrink, appropriately sized holes were drilled in one PVC end cap. The electrodes and thermistor were inserted and epoxied into place, using copious amounts of epoxy to ensure water tightness.

Using another end cap, a hole was drilled so that a four conductor cable could be run through the hole. Again the cable was epoxied into place using copious amounts of epoxy to ensure water tightness. Quick connects were used to connect the wires from the electrodes and thermistor to the cable, and the end caps were screwed into place.
Circuit board

The circuit for the CT sensor is fundamentally a voltage divider. An example of a voltage divider is shown above, and the relationship between input (Vin) and output (Vread) voltage is given by Vread = Vout(R2/(R2+R1)). Using some algebra, you can solve the equation for R2, which gives R2 = (V2*R1)/(V1-V2). By using a known input voltage (3.3V square wave in this case), a known value for R1, and reading the voltage at Vread, the value of an unknown resistor (i.e. water sample) at R2 can be determined.

The actual CT circuit is only a bit more complicated and is shown above. The resistor values of the voltage divider can be selected from a number of values using a digital switch. In the above circuit resistors R1-R4 would correspond to R1 in the simple voltage divider circuit; and R5, R6, and R8 (Rprobe) would correspond to R2 in the simple voltage divider circuit. By selecting a resistor (R1-R4) that is closest to the resistance of the sample to be analyzed, a more accurate measurement can be made. Also, resistors R5 or R6 act as an internal reference allowing you to check for drift before making a measurement with the conductivity probe (R8).
Conductivity Calibration
The conductivity calibration is fairly straight forward, although a calibration must be preformed for each conductivity range being measured (i.e. each resistor- R1-R4 - that can be selected by the digital switch). The conductivity calibration is done by simply setting the digital switch to the desired range (on board resistor), then putting resistors of accurately known values in place of the conductivity cell and recording the voltage output at the microcontroller.
Once the relationship between read voltage and cell resistance is know from the above calibration, the next step is to determine the cell constant of the conductivity cell. The cell constant is the relationship between measured resistance and conductance. To determine the cell constant you simple select one of the on board resistor values (R1-R4) that has been calibrated, and the conductivity cell (R8 in the above circuit) with the digital switch. Then measure the resistance of a few solutions of known conductivity (i.e. a KCl solution).


Temperature Calibration
The temperature calibration was done in a similar fashion as the conductivity calibration. The calibration is done by putting a resistor across the terminals where the thermistor would be attached and measuring the voltage output. The resistors should span the range of resistances the thermistor will have in the temperature range expected. This can be determined by looking at the Resistance-Temperature (RT) data provided with the thermistor.
Once the resistance to output voltage is known for the thermistor circuit, the next step is to fit to the RT data provided with the thermistor to an equation in Excel or like program. From the above calibration and the equation generated from the thermistor’s RT data, the temperature can be determined.
[ ]
]
11 Comments
Ben,
Fantastic job on this! Excellent descriptions of the entire system -- the electronics, the probe design, and the calibration procedure. Very, very inspiring.
The ability to switch known resistors into the measurement circuit in order to check for drift is a very clever approach, and would be particularly useful for a field-based sensor.
What AC frequency are you using? I've come to understand that 10 kHz might be a nice frequency for standard conductivity measurements, but am eager to hear your reasoning for whatever frequency you're using ... new to electrochemistry, myself.
Also: in the end, what voltage ends up being applied across the probe? I believe that one would like to keep the voltage significantly below 1 Volt, in order to avoid electrochemical reactions. It might be obvious from the circuit, but I'll dig in ...
Thanks for this!
Is this a question? Click here to post it to the Questions page.
Reply to this comment...
Log in to comment
Hi donblair, thanks. There is still a bit of development to be done, especially for extended deployments, but I think the design shows promise.
I used a 5 kHz square wave for the data and calibration in this research note. I came to use this frequency mostly arbitrarily (I have seen instruments use frequencies anywhere from 1 kHz to 10 kHz). I have not seen any good resources that evaluate the effectiveness of different frequencies for conductivity measurements, and would be interested if you know of any. Its easy enough (one line of code) to change the frequency, and I may play around with it a bit more.
For the applied voltage, I'm using +-1.65 V across the cell. Since there is not reference electrode, and if you assume that water is the first redox active species in the solution, then I believe you have ~1.2 V plus the overpotential of the electrode (~0.6 V for graphite) before you start oxidizing or reducing water. If you do have other redox active species in solution I can see the advantage of keeping the voltage as low as possible. I'll have to test that out also for the next generation of the circuit board.
Reply to this comment...
Log in to comment
I've got a question. Is there any reason you couldn't use metallic electrodes instead of the graphite? Stainless steel would be more rugged and possibly easier to waterproof. I'm sure there is, but I'm an EE, with know knowledge of this type of stuff.
Is this a question? Click here to post it to the Questions page.
Reply to this comment...
Log in to comment
Hi rfdave. To my knowledge the only requirements is that the electrodes be inert. I chose graphite because I had some laying around and its cheap. I would think a high grade stainless steel would work fine for low salinity waters and probably higher salinity waters for short periods of time. High salinity waters usually tend to be harsher, and I think if you want to deploy a sensor for an extended period of time stainless steel would start to corrode.
Reply to this comment...
Log in to comment
Thanks. I'm thinking about a Water quality Staff made from PVC with temperature, conductivity, and turbidity sensors build in, so I'm not thinking about long term immersion.
Reply to this comment...
Log in to comment
Hi Ben, There is a lot to dive into here. I would really like to learn how this circuit works. I'm also new to this, and have a lot of questions. This goes past my undergrad level of electronics.
I've heard about instrumental drift, but I'm not quite sure what it looks like. The measured voltages change over time, due to how temperature changes affect the electronics. Would it help to calibrate as close as possible to the expected mean temperature of the long term deployment, or are the R5 and R6 enough to minimize drift?
How do R5 and R6 compensate for drift? There are switches that allow the current to flow through R5, R6, or Rprobe. How are they used to correct for drift? (And why are there two switches on either side of the probe - is that to completely isolate it from current?)
How does a digital switch work? Can you switch it "on" or "off" by sending a certain signal to it? Or does it work another way?
I made an overlay of the circuit diagram with the different parts of the voltage divider (V+, GND, R1, R2, Vread) outlined:
I have an introductory level familiarity with op-amps, but I'd like to learn what they're used for in your circuit. The voltage follower at IC1A ensures that the voltage at the output (1) equals the voltage at the non-inverting input (3). Why is that done? Is it to protect the voltage source, or boost the amount of current going through the circuit?
Similarly, what's going on at IC1C, R7, R13, and R14, and how does that differ from the "Ground" on the ideal voltage divider circuit?
And for the "Vread" section of the circuit, with 6 op amps, I am definitely out of my depth here. I see that there are two parallel lines connecting before and after the adjustable resistance, there are voltage followers, diodes, capacitors going to ground. I'm not sure what happens at IC2D, and R9 through R12 where the lines join. What is happening in this section, and why?
Then, it looks like the IC2C is a non-inverting amplifier, right before the Vread pin? What considerations go into making that and choosing the resistors.
Thanks for considering these questions. I hope I can dive right into circuit building, and start testing circuits like these.
Is this a question? Click here to post it to the Questions page.
Reply to this comment...
Log in to comment
Hello pdhixenbaugh, I like how you have colored the schematic, makes things much clearer. As for your questions, I'll try and answer them.
Firstly, for the issue of drift, I believe your description of its cause is accurate. Any change in the physical or electrical setup can cause drift, whatever the reason. The purpose of R5 and R6 is so that you can make a measurement of a known resistance. Only one of the resistors (R5 or R6) is used at a time, and which one used depends on which resistor your using for R1 in your schematic (R1-R4). I would select R5 if I'm using 100 or 1K Ohms for R1, and I would use R6 if I have 100K or 1M Ohm for R1. I would adjust the switches so that only R5 or R6 is in line to virtual ground (GND in your schematic) by closing the appropriate switch, and Rprobe and the other resistor (either R5 or R6 not in line to ground) are isolated by opening the relevant switches. Then I would record the measured resistance of R5 or R6.
By repeating the above process before and after making a series of measurements on a water samples (or whatever you may find to measure), you can adjust for any drift. For example: If your measured the resistance value of R5 before a series of sample measurements to be 1K and measure its value after the series of sample measurements to be 1.1K, then you know that the first sample is correct and the last sample measured is 10% too large. You can simply linearly interpolate to get the error for the samples in between.
For the operation of the digital switch, you send it an 8 bit digital signal from a microcontroller. The switch I'm using in MAX395CWG. I'll try and upload the microcontroller code I'm using here soon, just have to clean it up a bit first.
For the opamp (IC1A), its purpose is to boos the current capacity of the signal. The signal is generated from the microcontroller, which has a 40mA limit (I think). By using the opamp the current limit is increased to 100 mA (I think, have to find the data sheet again).
For ICIC (virtual ground), the opamp isolates the voltage divider from the rest of the circuit. This is done because when the voltage divider is not isolated, it becomes a voltage divider under load (http://hyperphysics.phy-astr.gsu.edu/hbase/electric/voldiv.html), which effects the output voltage.
For the Vread sections, I would check out this video (https://www.youtube.com/watch?v=jllsqRWhjGM).
Hope that helps.
Ben
Is this a question? Click here to post it to the Questions page.
Reply to this comment...
Log in to comment
Ben, thank you for that explanation, it is very helpful in understanding many of the challenges and solutions presented by conductivity field measurements. Looks like I want to get a few more opamps to try some of these circuits. I wonder if some of the noise others have seen in their conductivity measurements has come from the ground acting under load...
Thanks!
Reply to this comment...
Log in to comment
Hi Ben, checking in here -- have you used this design any further? A few folks would be very interested to see what kinds of accuracy and precision you were getting, especially in a long-term deployment setting.
Thanks, Patrick
Is this a question? Click here to post it to the Questions page.
Reply to this comment...
Log in to comment
Hi Patrick. I'm currently out in the field as part of a research team and won't be back to my lab for a few weeks. Once I get back I can look at some of the data I took and give you an answer to the accuracy and precision. For long term deployments I believe the stability of the reading is mostly going to be effected by biofouling. I have thought about putting a waterproof servo with a brush on the probe to wipe the electrodes, but I haven't gotten around to it yet...
Hello @bhickman, I know it has been a while since your last message but I have read this thread with a lot of interest, and I was wondering if you went any further in the development ? Please let me know. Best regards
Is this a question? Click here to post it to the Questions page.
Reply to this comment...
Log in to comment
Login to comment.