Optical Monitoring of Particulate Matter
Optical PM monitoring of Particulate Matter (PM) is an attempt to measure the diameter of particles in flight. Optical monitors are a low-cost way to get real-time data about particles in the air. They are an automated, electronic version of the effect seen in a darkened room by light glinting off of dust in a sunbeam.
Comparisons
A number of comparison tests of commercially available sensors have been performed or are underway. Please add to this list if you know of other comparative evaluations.
- SouthCoast AQMD's Air Quality Sensor Performance Evaluation Center
- AQICN: Air Quality sensors experiments on the World Air Quality Index project
- EPA Evaluation of Field Deployed Low Cost PM Sensors
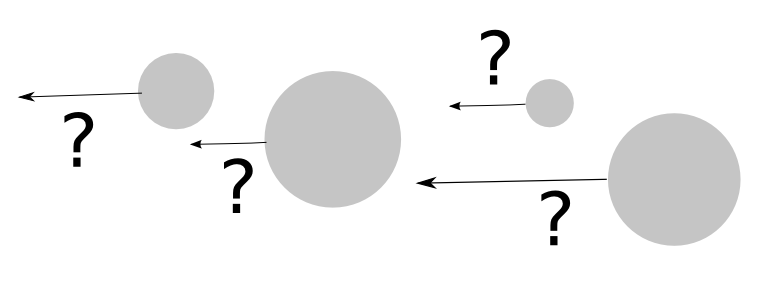
Questions
| Title | Author | Updated | Likes | Comments |
|---|---|---|---|---|
| Is it important to account for humidity using optical particulate matter monitors? | @stevie | about 7 years ago | 0 | 6 |
How optical particle sensors work
A sensor and a beam of light sit at an angle to each other. As a particle passes in front of the light, some light is reflected towards the sensor. The sensor registers a pulse for as long as the particle reflects light to the sensor. If the air is moving at a consistent speed, the length of this pulse can be used to estimate the particle’s diameter.
Read more in-depth in this illustrated post by @DonBlair.

The sensor registers a pulse for as long as the particle reflects light to the sensor:

With an estimate of particle diameter and an estimate of average particle density, airborne concentrations of PM can be extrapolated. These estimates are somewhat imperfect, as accounting for particle density and the estimating and accounting for the quantity of water in droplet mode particles is not straightforward. Both of these issues complicate the process of correlating optical PM measurements to regulatory monitoring.
Issues with optical particulate data
Humidity and optical PM measurements
Optical monitors detect droplets and dust, and droplets are often ‘wet,’ having absorbed water in the humidity.

Humidity measurements are frequently used to correct for the expected effects of humidity on droplets. These corrections are based on assumptions about the percentage of dust that is in a droplet mode and succeptable to wetting, and the percentage that is dust.
Variable particle density
Most low-cost optical monitors assume a standard particle density based on a ‘test dust,’ such as the standard “Arizona Road Dust,” now ISO 12103-1:1997. Read more on the history of test dust in this article from Powder Technology.
Some more expensive optical monitors combine and optical monitor with a filter-based PM monitor. The filter is weighed (‘gravimetric analysis’) before and after sampling to create a calibration factor for particle density.
Emulating PM2.5 & PM10 impactors with correction equations
PM regulatory standards are technology-based, meaning that measurements of PM10 must be related back to the results from a specific PM10 monitor. While optical monitors can set a ‘sharp’ cutoff of particles, filter-based Federal Regulatory Methods depend on the mechanical sorting of an ‘impactor’, which has a less sharp cutoff.

The sharpness of regulatory impactors can be simulated by calculations detailed by Hinds 1999 page 255:
The average mass concentration is discrete integral of the individual particle’s contribution to mass concentration, multiplied by a curve for respirable PM10 and PM2.5.

| Values of Ei |
|---|
| E = 0.9585—(0.00408 x projectedDiameter2) | for projectedDiameter <15μm |
| E = 0 | for projectedDiameter > 15μm |
E for PM 2.5:
PM2. 5 = [1 + exp((3.233 x projectedDiameter) - 9.495)^-3.368
Available Optical PM monitors & sensors
Filter-calibrated Optical Monitors
Both Dusttrak and pDR-1500 have a filter for "gravimetric analysis" (weighing the quantity of dust collected) as an additional calibration.
Currently there are only proprietary commercial services available for reading commercial sensors, such as Netronix, which costs around $100/month.
Low cost and open source Optical Monitors
Here we will examine four in-development projects using almost identical sensors (Shinyei PPD42NS, Syhitech DSM501A, Shinyei PPD60PV ) and a low-cost commercial competitor with a similar design, the Dylos.
Current efforts to correlate low-cost sensors with commercial reference sensors, and each other are available. AQICN’s effort appears the most comprehensive Others include: AirBeam, Sonoma Tech, Gao et al. 2015, Holstus et al 2014, Purple Air. Thanks to @Willie for many of those links.
Here is a little background information from the EPA on their take of some of these technologies:
Airflow strategies
Passive airflow: a system that doesn't actively control for airflow, either using natural or thermal convection to drive particulates through.
Active airflow: The use of a fan or pump to control and/or meter airflow through a sensor.
The Purple Air
The Purple air tool has become more widely used as a means for monitoring particulate matter on a community level. The benefits of this tool in relation to other sensor based tools are that it is on the low cost side, it is weather proof (unlike the dylos), it has versions that allows users to have data directly uploaded to the internet, and other versions that also store data in the device itself. The Purple Air tool is also supported through an online mapping tool that allows people to see each individual Purple Air monitors reporting on a map. Here is a link to more information on the Purple Air.
Dylos DC1100

The Dylos uses a small fan. A great teardown is here:
| Title | Author | Updated | Likes | Comments |
|---|---|---|---|---|
| Nothing yet on the topic "dylos" -- be the first to post something! |
Speck
by Carnegie Mellon’s CREATELab, my previous notes.
the Speck uses a small fan:

hooked up to their open source fluxtream platform and designed for home use, it's being used by the Southwest Pennsylvania Environmental Health Project.
| Title | Author | Updated | Likes | Comments |
|---|---|---|---|---|
| Nothing yet on the topic "speck" -- be the first to post something! |
Airbeam
developed by the HabitatMap, it is designed to hook to an android device. It is open source hardware and uses a small fan.

| Title | Author | Updated | Likes | Comments |
|---|---|---|---|---|
| Nothing yet on the topic "airbeam" -- be the first to post something! |
Dustduino
in development by @schroyer and @willie passive airflow via a convection current, it sends data to xively

