Hank Boschen and Concerned Chippewa Citizen have been deploying ~$200 Dylos 1100 laser particulate monitors around NW Wisconsin.
Dylos in Wisconsin

How the Dylos works
The Dylos uses a similar mechanism to the lower cost Shinyei and Syhitech sensors found in the Speck and Dustduino designs under development, only using a laser rather than focused light whose interruption is measured to gauge dust transit. Don Blair did a great job explaining and illustrated the concept of identifying particles by their transit through a beam of light..
Mattias Wandel did a breakdown on the Dylos, and the insides look very similar to the inside of a Speck:
How the Dylos is being used
Since 2011 Hank Boschen has been working to setup Dylos monitors, more can be seen under the menu at the top of that page"Laser Air Pollution Monitors." Jeff Falk has also done an analysis of the Dylos monitoring program. PDF link here.
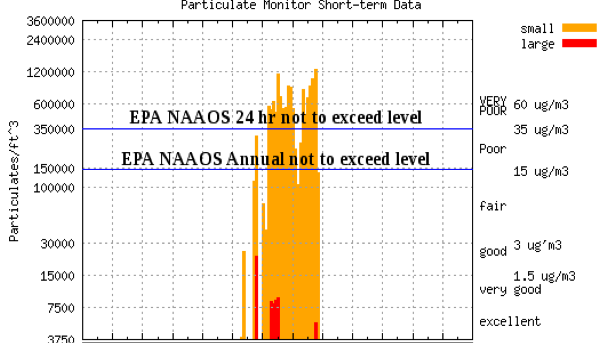
Red markers are active monitoring sites. Click on them to see data:
View Frack Sand Mine Locations, MN and WI in a larger map
Official acceptance of the data has not been forthcoming. Concerns from the Wisconsin DNR (dept. of Natural Resources) and industry groups are that the Dylos monitors use a proprietary calibration, are designed for indoor use, and that the data is just particulates and can't distinguish silica. Distinguishing silica in "fugitive emissions" is not well studied. Drexel University is studying the accuracy of Dylos sensors in comparison to filter-based methods, although I haven't dug into that research yet.
Jeff Falk's Analysis
Jeff starts by noting that wind, humidity, and the differing reflectance of particles are not accounted for by the Dylos, Still, across sites where monitors are up and downwind from a pollution site, the measures will share the same weather effects. The Speck particulate monitor includes a humidity sensor, probably for this very reason.
In his final analysis, Jeff uses only dates where the wind was blowing away from the AOC sand facility, ignores high humidity days (80% or above), and does an analysis with the remaining data. He finds that: "of the 57 days with wind condition and humidity appropriate, 3.5% show possible exceedances of the EPA PM2.5 standard on a 24 hour basis, 37% show possible exceedances of this standard on an average hourly basis, and 51% have at least one hour which possibly exceeds this standard."
He also notes that it is clear that the DNR is not following best monitoring practices and all but admits it in their report. Pretty damning, and backed up by data!
7 Comments
The graph is wonderful and would be very informative if one could be confident of the story it tells. In all cases of use of particle counters one has to ask how the process gets from counts to concentrations. The methodology used here is quite questionable and no attempt has been made to validate it. In addition there is the question of the appropriateness of comparing 10 minute counts (translated into concentrations) to epa standards that are 24 hour averages and/or yearly averages. (Actually they are more complex than even this.) I applaud this citizen attempt and say this as hopefully constructive and informative criticism.
Reply to this comment...
Log in to comment
Did you see the article AmySoyka posted about the Dylos? http://publiclab.org/notes/Schroyer/06-26-2014/broadcast-dust-readings-from-a-smartphone#c9306
Is this a question? Click here to post it to the Questions page.
Reply to this comment...
Log in to comment
@donblair-- the author doesn't seem to understand the terminology in use. The conclusions are based on a misunderstanding of what PM2.5 actually means I posted this comment:
PM2.5 is not the same as 2.5µ. it means particles with a mean aerodynamic diameter of 2.5µ. So a PM2.5 measurement is 50% above 2.5µ and 50% below. it includes 0.5µ particles. The same goes for PM10, it includes 2.5µ particles. https://en.wikipedia.org/wiki/Aerosol http://publiclab.org/wiki/particle-sensing
Reply to this comment...
Log in to comment
maintenance is an issue-- look at these dylos monitors in China building up particulates http://aqicn.org/faq/2013-10-21/dylos-air-particule-conter-experiment-maintenance/
Reply to this comment...
Log in to comment
As I understand it PM2.5 implies an aerodynamic diameter of 2.5 microns, straight forward with no "mean" involved. The "mean" enters with the epa approved monitoring equipment which use a "cyclone" with a 50% cut point of 2.5 microns. This is the point at which 50% of the particulate mass captured will be below 2.5 microns and 50% above. Similar statements would apply to PM10.
Reply to this comment...
Log in to comment
I've been operating on the assumption that the EPA/ISO standard = PM2.5. I guess this is an etymology question. which came first: PM2.5 or the EPA/ISO standard PM2.5? the standard defines PM2.5 particulates by the 50% cutoff point. If we're measuring PM2.5 I've been assuming that we're getting an equivalent to this filtration standard, not a measurement of just 2.5µ particles.
Is this a question? Click here to post it to the Questions page.
Reply to this comment...
Log in to comment
Let's try again. Gravimetric monitors capture particles and allow a weight of those captured to be determined. The distribution of aerodynamic diameters of the particles captured will depend upon the particulate in the air being sampled and the design of the monitor. I've seen an explanation of a 50% cutoff point of 2.5 microns as a particulate with aerodynamic diameter of 2.5 microns has a 50% probability of being captured. The probability of capture decreases as the aerodynamic diameter increases and the probability of capture increases as the aerodynamic diameter decreases. So a epa approved PM2.5 monitor output will be capable of including some particulate with aerodynamic diameter greater than 2.5 microns as well as less than 2.5 microns. The actual distribution will depend on what is in the air sampled. How any of this is actually determined and put into the design is beyond me, but it has to do with the design of the cyclone I believe.
Reply to this comment...
Log in to comment
Login to comment.