NDVI stands for "Normalized Difference Vegetation Index". NRG stands for "Near-infrared / Red / Green". NDVI and NRG are both ways to visualize the amounts of infrared and other wavelengths of light reflected from vegetation. Because both these methods compare ratios of blue and red light absorbed versus green and IR light reflected, they can be used to evaluate the health of vegetation. It's a snapshot of how much photosynthesis is happening. This is helpful in assessing vegetative health or stress. (Read more here: https://www.agronomy.org/publications/jeq/articles/36/3/832) ## Do-It-Yourself These techniques for vegetation analysis were developed for satellite imagery, but at Public Lab, we've been working a lot on capturing infrared imagery using our DIY [near-infrared camera](/wiki/near-infrared-camera) setup, and combining it with visible bands to produce NDVI images such as the one above. ## What these images mean What exactly are these images we're trying to make? What do they tell us about vegetation, and why? These diagrams should help to understand what it is we're doing and why these are good ways to analyze plant life. ## The NDVI equation [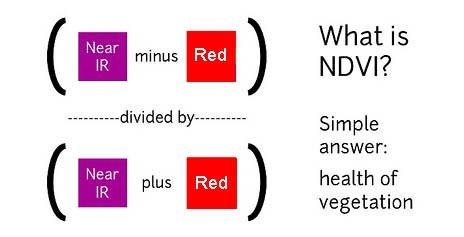](/i/44723) **NDVI = (Near Infrared - Red)/(Near Infrared + Red)** NDVI is a ratio which tries to emphasize photosynthesis while filtering out sun glare. The above equation is run for every pixel, using source data from an infrared photo and a visible light photo, like this pair: [](https://publiclab.org/system/images/photos/000/021/771/original/5390895115_c9d4d38fec_o.jpg) The result can be false-colored to make the high-photosynthesis areas more clear, and used to examine where plants are and how healthy they are. [](https://publiclab.org/system/images/photos/000/021/770/original/PetVISNDVIcomp.png) _Figure above: Normal color photo (right) and normalized difference vegetation index (NDVI) image (left). NDVI image was derived from two color channels in a single photo taken with a camera modified with a special infrared filter. Note that tree trunks, brown grass, and rocks have very low NDVI values because they are not photosynthetic. Healthy plants typically have NDVI values between 0.1 and 0.9. -- @cfastie_ ### Activities Here are a range of activities you can do to produce and interpret your own NDVI imagery, whether downloaded from a satellite imagery provider or [collected yourself using a DIY technique](/wiki/multispectral-imaging) [activities:ndvi] ****   Most DIY converted cameras today (those from Public Lab) use RGN instead of NRG, so the blue channel represents infrared instead of the red channel. That looks like this: [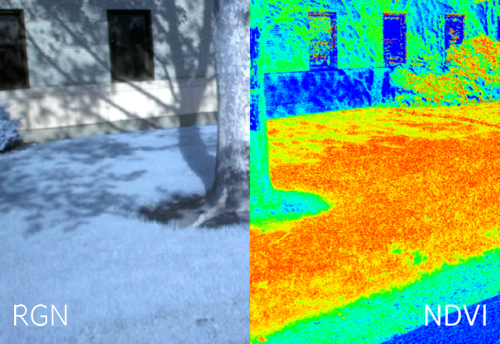](/i/45468?s=o) **** ## NRG imagery Some people are also interested in producing NRG imagery (like the below image), where `Near-Infrared, Red, and Green` are used to compose a picture instead of the usual `Red, Green, and Blue`. [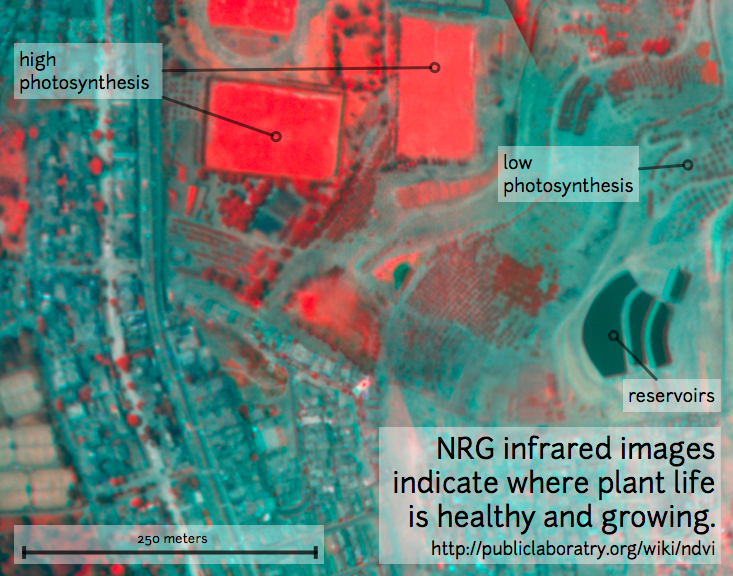](/i/25064) This diagram explains the swapping, which allows us to 'see' infrared as if it were a normal color: [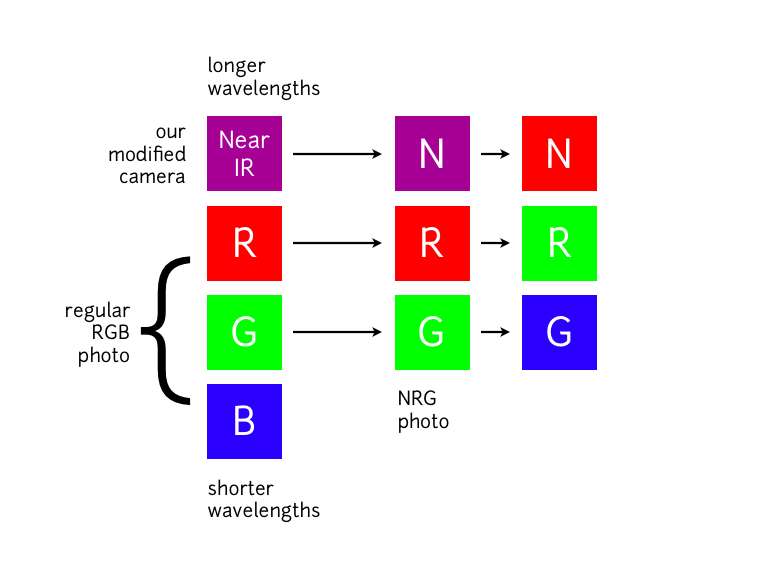](/i/25063) **In NRG images, the deeper and clearer the red color, the denser and healthier the vegetation (more or less).** ### Questions [questions:ndvi] ### Other examples of DIY NDVI imaging From around the internet: Begin watching at 2 minutes to see the resulting imagery: *This topic is part of the [Grassroots Mapping Curriculum](/wiki/mapping-curriculum) series.* **** [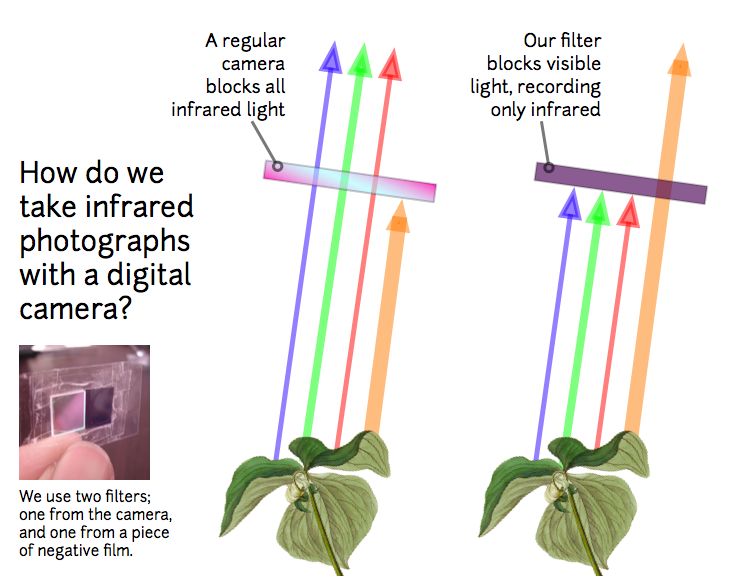](/i/25066) [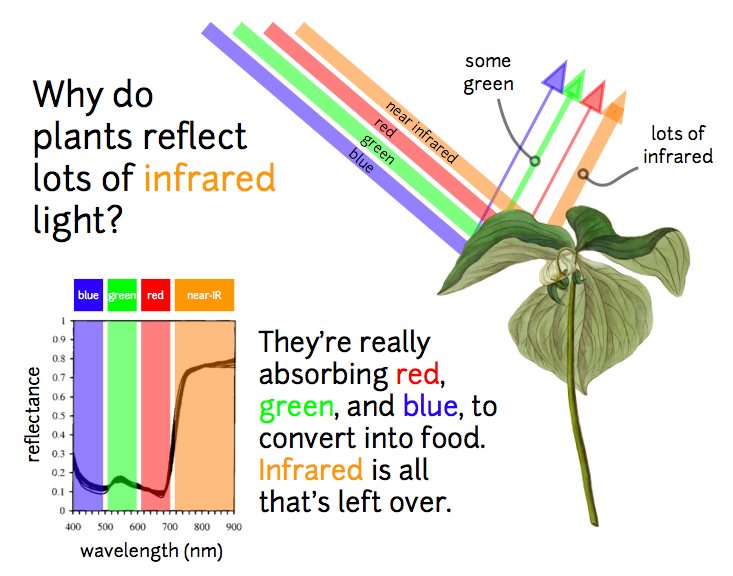](/i/25065) ...
| Author | Comment | Last activity | Moderation | ||
|---|---|---|---|---|---|
| dannysmith | "@nedhorning I think you're right about the expecting the unexpected with this camera, when I get back to the lab later in the week I'll run a trial..." | Read more » | almost 7 years ago | |||
| Endure1 | "The Raspberry Pi v2 camera uses a Sony IMX219 sensor. Here is the spectral response of the sensor found in their datasheet. RASPBERRY_PI_CAMERA_..." | Read more » | almost 7 years ago | |||
| jdburnett | "Ned's last comment reminded me of something I found with our equipment a few years ago. My lab had 4 NIR converted cameras. Three had R & IR p..." | Read more » | almost 7 years ago | |||
| jdburnett | "@dannysmith I will second Ned's thoughts. I assume you are using raw image format out of your camera to increase bit depth and avoid dealing with t..." | Read more » | almost 7 years ago | |||
| nedhorning | "Hi dannysmith - I’m glad to hear the note was useful to get you started. I find it helpful to plot both red and blue channel regressions but I expe..." | Read more » | almost 7 years ago | |||
| dannysmith | "@nedhorning thank you so kindly for all of your work, the detail you have put into it has been a tremendous help to me! I have been lucky enough to..." | Read more » | almost 7 years ago | |||
| Tiago_Maciel | "good tutorial!! Can I use HC-SR04 to data? " | Read more » | almost 7 years ago | |||
| cfastie | "Computing NDVI requires a value for the "brightness" of both red light and near infrared light for the same part of a scene (or for each pixel). Un..." | Read more » | almost 7 years ago | |||
| cfastie | "Oh, you're right. The older lut used in the images above can be found here: https://publiclab.org/wiki/photo-monitoring-plugin " | Read more » | about 7 years ago | |||
| plnedestroyer | "the file in that one shows a different Lut than the one you are using in these images " | Read more » | about 7 years ago | |||
| cfastie | "The lut file for use in Fiji is available for download here: https://publiclab.org/notes/cfastie/08-26-2014/new-ndvi-colormap In a comment to that..." | Read more » | about 7 years ago | |||
| plnedestroyer | "Okay I have everything ready to go but I have to ask you for the LUT file that you are using for your image then I'm set! " | Read more » | about 7 years ago | |||
| plnedestroyer | "okay, yeah I understand it way better now, I just need to figure out how to get the LUT on it, that was my main confusion, well and still is a bit,..." | Read more » | about 7 years ago | |||
| cfastie | "What Fiji does is a bit confusing. In a normal histogram the x-axis is brightness so 0 (at the left end) is black and 255 (at the right end) is max..." | Read more » | about 7 years ago | |||
| plnedestroyer | "Ah okay got you, I was ultra confused,but how would that work, since its only putting the values on the histogram as just the brightness of the pix..." | Read more » | about 7 years ago | |||
| cfastie | "Fiji made that histogram of the color NDVI image. The NDVI image is not an RGB color image (it is a single channel image with a color look up table..." | Read more » | about 7 years ago | |||
| plnedestroyer | "where can I find how to do so, I looked through the tutorials and did not find anything on making custom histograms, I am able to make a b&w hi..." | Read more » | about 7 years ago | |||
| cfastie | "I used Fiji (ImageJ) to make the histograms of the NDVI images. Fiji will make a couple of different kinds. " | Read more » | about 7 years ago | |||
| plnedestroyer | "@cfastie did you use a plugin to get the color histogram for the ndvi, because I am creating ndvi images from infrared but I need a histogram from ..." | Read more » | about 7 years ago | |||
| plnedestroyer | "alright thanks guys, I will try it " | Read more » | about 7 years ago | |||
| imvec | "Ey @plndestroyer you can find some Fiji (ImageJ) video tutorials here ;) https://publiclab.org/notes/xose/12-06-2016/afloss-collection-of-tutorials " | Read more » | about 7 years ago | |||
| warren | "Does anyone have some more photos of this conversion process we could show here, more step-by-step? " | Read more » | about 7 years ago | |||
| cfastie | "The histograms were made with Fiji: http://imagej.net/Fiji/Downloads " | Read more » | about 7 years ago | |||
| plnedestroyer | "im talking about the histogram for the infrablue, so I can make a histogram from an image " | Read more » | about 7 years ago |