Goals
In Public Lab's spectrometry project, we've long used compact fluorescent lamps (CFLs) as a reference to wavelength calibrate our DIY spectrometers. This guide will show you how to do this in about 15 minutes.
I believe that if your spectrometer is properly constructed, you should be able to get to about 1nm resolution -- complete the activity and post your results to help determine if this is true (read more here)!
What you'll need
- a compact fluorescent bulb
- an account on PublicLab.org to log into Spectral Workbench with
- one of our spectrometry kits or any spectrometer that outputs images
What we're doing
Basically, when you look at a graphed spectrum (as in the image above), you see a graphed series of intensities for each color along the spectrum, but the first time you do it, you won't see the wavelengths labelled in nanometers. This is because we just start out with an image from the webcam in the spectrometer, and don't know exactly which pixel of the image is at which frequency of light.

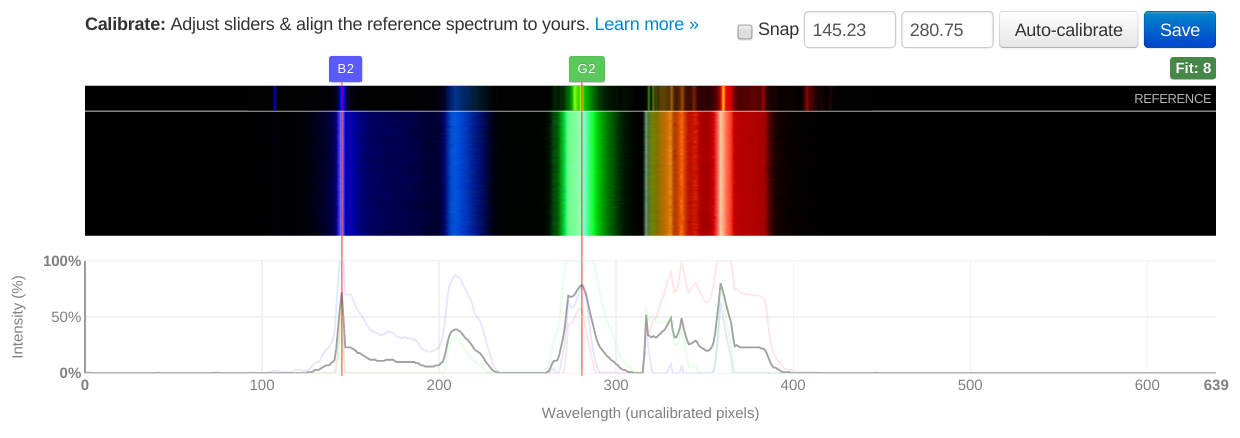
A CFL bulb is filled with mercury vapor, which when energized, emits a really well known spectrum, and one with very sharp, recognizable "peaks" -- as shown in the image above. These peaks always happen at the same wavelength, so we can recognize them by color and order, and compare our spectrum to a known reference to figure out the wavelength of each pixel of our spectrum.The two peaks we look for are:
- the mercury 2 line - "B2" at ~435.8 nanometers
- the mercury 3 line - "G2" at ~546.1 nanometers
Video
There's a video walkthrough of this process here:
This 10 minute video goes into greater depth on how calibration works and how to do it well:
Let's start!
Step 1: Open SpectralWorkbench
Plug in your spectrometer. Log into Spectral Workbench with a PublicLab.org ID and navigate to the Capture interface at https://spectralworkbench.org/capture.
Follow the prompts to connect to your webcam -- if it's running, you should see either a black image or some rainbow patterns from stray light. Don't choose a cross section yet, though! It'll be helpful to do this while pointing it at a CFL bulb.
Step 2: Image the bulb
Find a CFL bulb -- the spiral type is pretty common, as shown below. Point your spectrometer at it, watching the Capture window to see when the rainbow of your CFL bulb spectrum appears as in the example. If you've built your spectrometer correctly, you should be able to select a cross section of the image that cuts right through the middle of the spectrum.

This step can be tricky -- it's good to be within a foot of the bulb or you might miss it, but it can also be too bright, and your colored peaks will "blow out" and have flattened peaks. Then we won't be able to find the very top of the peak -- so if this happens, try shining the lamp closely onto a piece of white paper or on the wall, and pointing the spectrometer up against that.
Overexposure
Note that if your peaks /are/ "blown out," they'll look like the image below. Notice that the "color channels" represented by the blue, red, and green graph lines are hitting the "100%" mark and are really not recording data anymore, they're just completely saturated:

If this happens, checkout these tips for reducing exposure.
Step 3: Calibrate
Once you have your CFL spectrum image saved, you'll see a blue button below marked "Calibrate" -- click it!

As you can see in the above screenshot, you're presented with two sliders, and a reference spectrum, a pre-calibrated spectrum which is actually a version of @cfastie's "snowsky" CFL calibration, one I've used a lot as it's super sharp and has very low noise.
- When you click Calibrate, it will attempt to auto-calibrate or "guess" -- trying to automatically line up the two spectra. If it looks good, just click "Save."
- If not, drag the sliders yourself. The "Snap" checkbox will make the sliders "stick" to nearby peaks.
- Once you have a good match (the colored lines or "peaks" in the two spectra are lined up), click "Save."

Your calibration will be shown as linearCalibration in the Operations table below. If you want to try again, be sure to delete the previous calibration -- and make a new one. Don't make two calibrations!
Note: The system sometimes does not handle image reversal well. Sometimes horizontally flipped images can cause problems, so if it looks like the auto-calibration is opposite -- i.e. right to left instead of left to right. If this happens, you could try to "Set new cross-section" which will get fresh graph of data out of the image. We hope to solve reversal problems once and for all in an upcoming version.
How good is your calibration?
You may notice the green indicator that says "FIT" to the right. This is an attempt to compare the expected ratio of three known peaks to the peaks found in the image. Unfortunately, it has some shortcomings, and we'll probably be switching to a root-mean-square error approach, where we compare a much larger # of points to those of a known spectrum, after height-adjusting for the baseline and maximum peak height. We'll see if that works better, but for now, please be aware that the "FIT" indicator is not that reliable.
How often to calibrate?
It's good practice to calibrate at the beginning of each session of using your spectrometer, at a minimum. Some people may calibrate at the end too, to ensure it hasn't drifted during your tests. If you find that your calibration holds (by comparing a set of previous calibrations) you may not need to as often. But if you pack it up, travel with it, or modify it, you should definitely re-calibrate to be sure.
Cross-section
If you change the cross-section line (in the steps on the Capture page) and your spectrum is not perfectly straight, a different cross section could move your spectrum left or right, and ruin your calibration. Be sure you're using the same cross section!
Copying calibrations
What now? Once you've calibrated a single spectrum, you'll be able to apply that calibration to all of the spectra you've collected with that instrument (as long as you don't change anything, like the cross section). Since both images are the same size, Spectral Workbench will copy over the wavelength position of each pixel from the calibration image to the new image, and your spectrum will then be calibrated.
Resources
This page was adapted from these two older pages, which have some more details, especially on cross sections and brightness control:
- https://publiclab.org/notes/warren/09-30-2015/new-wavelength-calibration-procedure-preview-for-spectral-workbench-2-0
- https://publiclab.org/wiki/spectral-workbench-calibration
Replicating this activity
Try it out and leave a response here, whether you need help, or if you've successfully gotten your spectrometer calibrated! And link to your spectrum so we can see how you did. And if you see a way I could improve this guide, please leave a comment!
12 Comments
I'm also looking for a better photo of a Desktop Spectrometry Starter Kit pointed at a CFL bulb, so if you have one please help me improve this post!
Reply to this comment...
Log in to comment
@warren
Hi Warren, let me introduce myself. My name is jurist, im freshmen of physics engineering student in University of Gadjah Mada. Currently, im taking optic class. Which my lecturer asked me to build a pinhole camera. To increase the camera resolving power, i need to select the best wavelength, however, due to spectrometer's cost, my lecturer advised to build one. Then, i was introduced to this website.
Things went good until i started to upload a picture, it wont calibrate and wont squeezed the image as usual. I am confused with most spectra which they have black background with a spectra lies in the middle which is easier to analyze by spectralworkbench. To be noted, whenever i edit a picture such as attempting to crop or tilt picture, it wont calibrate. how am i supposed to do?
Last, i would ask you what is the unit for the intensity in SB? Because it is only serve in percentage without any standard unit. Mostly, a percentage were meant to comparing two things like "object A is a half (50%) from object B"
I expect your fast respond due to the deadline of submission is getting closer
Is this a question? Click here to post it to the Questions page.
Reply to this comment...
Log in to comment
Jurist,
I tried to calibrate your spectrum but Spectral Workbench would not complete the task. I don't know why it did not work.
The intensity scale of a spectrum is relative because there is no easy way to calibrate the brightness of different colors from a photographic image.
Chris
Reply to this comment...
Log in to comment
@cfastie
Chris,
I am now able to measure my spectra using iPhone, i dont know why using mobile device is way more effective than PC. Also, how do you callibrate the intensity? My idea was finding the correction factor by dividing the data i got from spectraworkbench with the intensity value from Planck's Black body radiation (Since i use CFL, the manufacturer put its specifications including its CCT).
Best Regards,
Jurist
Is this a question? Click here to post it to the Questions page.
Reply to this comment...
Log in to comment
Hi, there are some steps for intensity calibration outlined in #exposure-calibration, but they're not that easy to follow -- we would love if you'd share any work you do to document and make that process easier. Thanks!
Reply to this comment...
Log in to comment
Dear Warren,
@warren
I could not click the hashtag. Also, could we have a live chat which we can discuss this topic any further? I do wait your respond
Sincerely, Jurist
Is this a question? Click here to post it to the Questions page.
Reply to this comment...
Log in to comment
I'm sorry - the tag should be #gain-control -- and although I don't have time myself at this point to do a live chat, you could perhaps ask on the spectrometry discussion list and there are lots of people who've used these tools there. Or perhaps if enough people are interested we could do an open call.
Reply to this comment...
Log in to comment
Hey!
I was trying to califrate a fluerescent bulb, and it appeared to fit good with the reference spectral workbench ives you, but when looking at the wavelenghts, it appears theyre completely wrong! Any idea on what I'm doing wrong here? Thanks!
Is this a question? Click here to post it to the Questions page.
Gosh, sorry for the late response! When you haven't yet completed the calibration, the numbers shown are for pixel position, not wavelength. Once you save, they'll switch to being for wavelength! Thanks!
Reply to this comment...
Log in to comment
Hi, I am confused! My calibration looks ok
but is I take a spectrum from a red LED screen I get something crazy:

thanks, John
Is this a question? Click here to post it to the Questions page.
Reply to this comment...
Log in to comment
hello, I'm trying to look for fluorescent bulbs but they are being phased out where I live and are becoming harder and harder to find is there an alternate reference which we could use?
Is this a question? Click here to post it to the Questions page.
FYI - this is posted as a question here: https://publiclab.org/notes/carmatic/02-24-2021/alternatives-to-cfl-for-calibration
Reply to this comment...
Log in to comment
Login to comment.