Spectral Workbench calibration

You'll notice that many spectra on Spectral Workbench have a scale showing "nm" or nanometer units on the horizontal axis. To get scaled data, you must calibrate your spectrometer. There are several kinds of calibration but here we're talking about wavelength calibration, which allows your spectrometer to display a wavelength value for any color of light it sees. Luckily, this is easy; read on:
The Calibration guide is now featured as a step-by-step Activity:
Try it out and post your results!
Advanced tips for calibration are listed here:
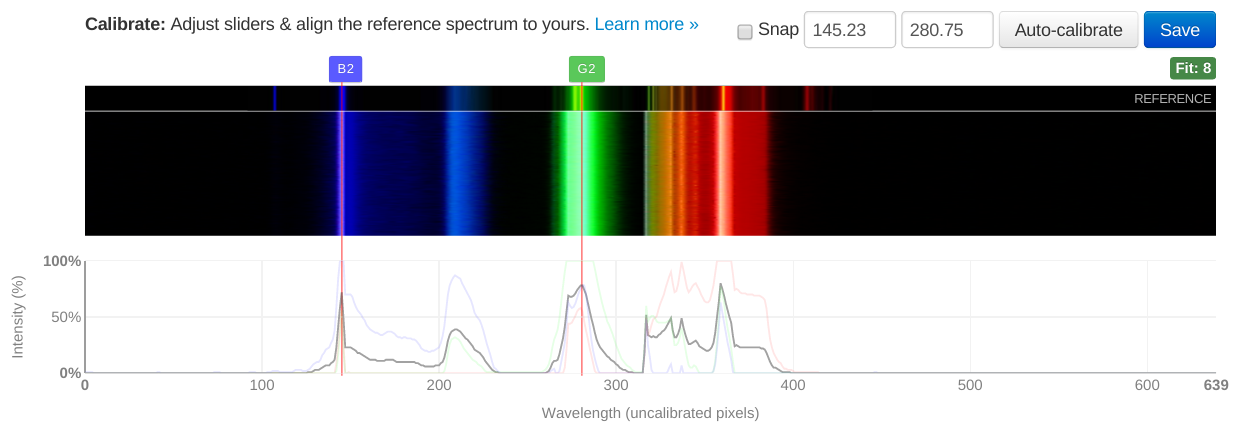
Snapping and fit
The "snapping" checkbox will make these two sliders snap to the nearest peak, which should make your calibration more accurate. You may notice that the reference is not precisely the same as even an ideal spectrum capture. This is because there can be non-linear distortions in the spectrum -- that is, some areas may be stretched differently than others, based on many factors such as the shape of your webcam lens, the grating you've used, and other things. The reference is as close as we've been able to get to an accurate spectrum, so you may need to turn snapping off and hand-adjust the alignment to get the best calibration.
Also, to the right side, there's a small box which says fit:10 where the number indicates how well the interface thinks your calibration is aligned with the reference. It basically compares the peaks in yours to where it thinks they should be if your calibration is correct. A good fit is 10 or below. (I've never seen a fit better than 7! -- @warren)
You can also enter numbers in the two boxes shown -- they're for B2 and G2, respectively, and they're measured in pixels in the unscaled original spectrum image.
Once you've aligned them, press Save.
Read more about snapping, alignment, and fit here.
Image reversal
If you've collected a spectrum image with the blue peaks to the right side, and the red to the left, it's the reverse of what Spectral Workbench expects. The easiest and best thing to do is to flip your webcam inside your spectrometer! Public Lab kits are all designed to be correctly oriented, however, so this should only affect custom built spectrometers.
However, you can calibrate a reversed spectrum, and Spectral Workbench will then flip your image back to align with your graph. This should resolve the issue, and copy into other spectra correctly, but it is one more thing to keep track of. If you have trouble with this, please file a bug report.
Copying calibrations
Once you've calibrated a single spectrum, you'll be able to apply that calibration to all of the spectra you collected with that instrument. Since both images are the same size, Spectral Workbench will copy over the wavelength position of each pixel from the calibration image to the new image, and your spectrum will then be calibrated.
Recalibrating
It's a good idea to recalibrate from time to time, in case your device gets shifted -- and you can compare a new spectrum of a fluorescent bulb with an old calibration to see if your device is drifting out of calibration.
If you're moving around with your device, definitely recalibrate before doing more scans.
Video
Watch this short video for a quick walkthrough of the whole process:
This 10 minute video goes into greater depth on how calibration works and how to do it well:
Cross section

Your spectrometer produces a 2D image of a spectrum, but to generate a graph, you must choose a horizontal cross section of pixels to read -- each pixel's brightness is then used to populate a graph of the spectrum's intensity.
The image above shows a yellow line crossing through the brightest part of a fluorescent bulb spectrum. Read below to learn why this is important.
Video cross section vs Image cross section
There are actually two moments when Spectral Workbench chooses a cross section.
Video cross section The first is when you are using the live Capture interface, and viewing a live video feed from the spectrometer, and you must choose a video cross section of the live video image. The live graph you see in the Capture interface is a graph of that cross section of pixels, which is also displayed as the top row of pixels in the 'waterfall display', which shows a descending series of cross sections.
Image cross section The second is when a saved image of a spectrum is used to generate a graph. By default, the first, topmost row of pixels is used to generate a spectrum graph. This makes sense for Live Capture because it is the most recent data captured by the device. However, if you upload a spectrum instead of using Live Capture, this may not be the best cross section -- typically, uploaded spectra are not waterfall displays, but just a photo of a spectrum. In this case, choosing an image cross section is more like choosing a video cross section in that you may want to choose a line that crosses the middle of the brightest part of the spectrum.
Changing the cross section
If you change a cross section after calibrating, the position of each color may not be the same as in your original calibration. This could make your calibration inaccurate, as it relies on the spectrum being in exactly the same place in each image.
However, if you captured your image using Live Capture, the image cross section represents a timeseries of calibrated cross sections, so you may choose any cross section, basing your decision on exposure and other factors.
Brightness
Generally you'll want the brightest part of the cross section, but sometimes that will result in parts of your spectrum being overexposed, where the pixel sensor is overwhelmed with too much light, and your data is "clipped" -- like when a speaker plays too loud a sound and the audio is distorted. Read about this in the Overexposure section.
If this happens, you may want to dim the light source, because to choose a less bright cross-section would mean you need to recalibrate (see above, in "Changing the cross section").
Defaults
Spectral Workbench uses a default video cross section in one of two ways. If you have any calibrated spectra (identified by the calibrated tag), the most recent is used to show a wavelength range on your capture graph. If that spectrum also has a video_row tag, it is used to set the video cross section for new spectra, to maintain consistency. The image cross section for new Live Captured spectra will still be the top row. If there is no available video_row tag, Spectral Workbench will choose a cross section halfway down the image.
For uploaded spectra, Spectral Workbench will default to the image cross section of the most recent calibrated spectrum, if you have one, using the image_row tag, or default to the top row if none exists.
Known issues
There is still a bug in the code that can cause odd calibration results -- Jeff needs to fix it (sorry!). Try pressing "re-extract" than after it clears the previous calibration, clicking "calibrate" again and following the instructions once more. Try comparing your calibration to another (search for "CFL calibration").
Custom calibrations
You can calibrate a spectrum with 2 known pixel positions and corresponding wavelength values with the following URL format:
https://spectralworkbench.org/spectrums/calibrate/SPECTRUM_ID?x1=242&w1=554&x2=483&w2=780
Where SPECTRUM_ID is the ID of your spectrum, x1 and x2 are the pixel locations, and w1 and w2 are the wavelengths for those positions.