This guide is a Beta version and is currently being tested! Testing may take longer than planned as due to supply chain issues caused by the Covid-19 pandemic some hardware components might be temporarily unavailable.
If you use the guide, please send @sashae and @sophied feedback: what worked, what was missing or could have been clearer?
Guide for the reception of NOAA satellite images using software defined radio on Windows or MacOS
We document here only a few ways to receive an Automatic Picture Transmission (APT) from active National Oceanic and Atmospheric Administration (NOAA) satellites. Other software and hardware setups are possible! Importantly, the guide is limited to Windows and MacOS. Please get in touch if you would like to contribute instructions for Linux or another operating system.

NOAA 19 N 80 W 2020-05-17 18-03 BST Multi-spectral Analysis
What you need
Hardware
- A computer of any model. 4GB RAM or higher is ideal.
- A software defined radio dongle. There are many kinds are available:
- RTL-SDR V3 is the cheapest, reliable and most adaptable dongle, in our opinion. (£27)
- Airspy Mini (£120)
- Funcube Dongle Pro+ *Not compatible with CubicSDR (£150)
- An antenna capable of receiving circularly polarised transmissions:
- Turnstile (£38)
We both use a 137 MHz turnstile antenna purchased from AMSAT UK. However the AMSAT UK online shop is frequently sold out of these antennas. They can be ordered directly from the original supplier Winkler Spezialantennen. - Quadrifilar Helix (QFH)
- V-dipole or Double Cross Antenna. There is a great tutorial on making a V-dipole antenna on RTL-SDR blog.
- Turnstile (£38)
- One or two cables. We recommend two options:
- an RF cable for connection between antenna and dongle (£5--10).
The RF cable should have 50 ohms impedance. Two metres is a good length. The cable needs a male SMA plug to fit into the dongle. - a USB A male to USB A female extension cable (£5--10) and a short cable or adapter to connect your dongle to your antenna. Ideally, the USB cable should be no longer than 3 metres to avoid interference. This set-up is based on the RTL-SDR dongle kits (£35), which come with a dongle, adapter, extension cable as well as a portable dipole antenna.
- an RF cable for connection between antenna and dongle (£5--10).
*Not all dongles are compatible with SDR# and CubicSDR. Before purchasing, check the dongle is compatible with the software you intend to use!
Note: #open-weather hopes to publish a tutorial on DIY antenna design and construction soon!
Software
- Software defined radio
- Virtual audio cable
- For MacOS: Soundflower (free)
- For Windows: VB Cable (free)
- Satellite decoding software
For both Windows and Mac OS we use the beta version of WXtoImg (free)
MacOS 10.15 Catalina compatibility issues
If you are running MacOS 10.15 Catalina you will not be able to download, install and use WXtoImg. This is because 10.15 Catalina no longer supports 32 bit applications. If you are in this position you have several options:
Humans
Once you've assembled the hardware, a day to half a day, a little patience and, ideally, a buddy to do things like hold your antenna while you tune the software.
Useful acronyms
| Acronym | Description |
|---|---|
| RF | Radio Frequency |
| APT | Automatic Picture Transmission |
| NOAA | National Oceanic and Atmospheric Administration |
| MacOS | Mac or Macintosh Operating System |
| SDR | Software Defined Radio |
| WAV | Waveform Audio File |
| AVHRR | Advanced Very High Resolution Radiometer |
| LEO | Low Earth Orbit |
Understanding what you are about to do
NOAA satellite transmissions
How do NOAA satellites collect data?
The images transmitted by NOAA satellites are produced by the satellite's primary scanning instrument called the Advanced Very High Resolution Radiometer (AVHRR). The instrument is designed to detect five channels of radiant energy from the surface of the Earth ranging from the visible spectrum to the near-infrared and infrared or thermal spectra. As the satellite passes over a given part of the earth, the AVHRR sensors collect and transmit data in near-real time. Think of the satellite as scanning Earth's surface line by line. In the resulting images each pixel is approximately 4 × 4 km.
How do they transmit data?
The NOAA satellites have inbuilt radio antennas that transmit the data collected by the AVHRR instrument on a frequency in the 137 MHz range. To minimise interference between satellites, each NOAA satellite transmits on a different frequency within the 137 MHz range.
How do NOAA satellites orbit?
NOAA satellites orbit the Earth sun-synchronously. A sun-synchronous orbit is a nearly polar orbit in which the satellite passes over a given point of the planet's surface at the same time everyday. The NOAA satellites follow a Low Earth Orbit (LEO). A LEO is an Earth-centered orbit with an altitude below 2,000 km. Each satellite circles the Earth approximately every 100 minutes.
Hardware
What does the antenna do?
Your antenna is a sensor. It catches electromagnetic waves and transforms them into an electrical current i.e. an electrical signal. All antennas are tuned to specific frequency ranges meaning that they receive or transmit these frequencies best. Most antennas are directional.
What does the RF cable do?
An RF cable is an insulated radio frequency cable. It includes a central conductor surrounded by a shield conductor. The cable carries electrical signals from one point to another (i.e. from your antenna to your dongle) without introducing interference.
What does the dongle do?
The dongle receives the electrical signal from the coaxial cable, filters it, and converts it from analogue to a digital I/Q so that it can be read by your computer.
Software
Why do you need software?
You need software to process the digital signal sent to your computer by your dongle. Software makes these signals visible and audible; other software decodes the signals transmitted by the satellites into visual images.
What are the different kinds of software needed?
To decode transmissions from satellites, you need three kinds of software:
- Software Defined Radio or SDR software to demodulate the radio waves caught by your antenna and tune to specific frequencies, like a traditional radio. SDR software outputs audio
- Satellite decoding software (e.g. WXtoImg) to take the audio generated by the SDR software and decode it into an image
- A virtual audio cable software to link the SDR software and the satellite decoding software...
How can I practice using SDR software?
The best way to practice using SDR technologies is to take your equipment (antenna, computer, dongle and cables) out into a nearby open space, plug everything in, launch your SDR software, and have fun exploring the radio spectrum. You can try things like changing modes (modulation), scrolling through ham radio bands, and switching frequencies. See below for start up guide to SDR software.
How do you connect your SDR software to your satellite decoding software?
No matter what kind of computer you have and what kind of SDR software you prefer, you need to send the audio output from your SDR software to your satellite decoding software (e.g. WXtoImg). You can use a range of free software to act as the 'virtual cable' between the SDR software and satellite decoding software. @sophied uses Soundflower (for Mac) while @sashae prefers VB Cable (for Windows 10).
Instructions

DIY satellite ground station, @sophied CC BY 4.0
Step 1: Assemble your kit
1. Connect your antenna to your RF cable. (If you need to assemble your antenna do this first)
2. Screw the coaxial cable into the non-USB side of the dongle (Be careful not to over tighten the cable connector as they are easily destroyed. No more than finger tight)
3. Plug your dongle into a free USB port on your computer
This is the basic set up that you will use to decode weather satellite images. In order for this set-up to become operational, you need to follow the steps below to install and run the software. It's a good idea to unplug your dongle before you continue.
Step 2: Install a virtual audio cable
1. Download and install a virtual audio cable. We use Soundflower for Mac (@sophied) and VB Cable for Windows (@sashae).
2. Follow the install instructions on the application's website.
Step 3: Set up your SDR software
If you are using SDR# for Windows, follow these steps:
See below for SDR software set up on MacOS

@sashae decoding a NOAA satellite pass using SDR# and WXtoImg
1. Download and install SDR#. Since SDR# involves a batch installer that requires an exchange of drivers, please refer to this SDR# Quick Start Guide.
2. Plug your dongle into a USB port. Launch SDR#.

SDR# start-up window
3. Select your Dongle type. Use the arrow to Select Source > [Your Dongle]
4. Set the Audio Samplerate. In the left panel, scroll down to view the Audio settings. Select Samplerate > 192,000 sample/second. Sample Rate is dependent on your PC's soundcard, so it may be that 192,000 sample/sec is not available, in which case try selecting a lower sample rate, like 48,000 sample/sec.
5. Adjust Audio Input and Output settings. Make sure the audio input is your computer's soundcard. For @sashae this means selecting MME Microsoft soundcard from the input list. Make sure the audio output is your virtual audio cable.
6. In the Audio section, make sure to uncheck the 'Filter Audio' box.

SDR# audio settings
7. Start receiving: Click the Play button at the top left of the window.
8. Tune to a frequency: In the frequency display box, click on the upper half of each number to increase, and the lower half to decrease frequency. You can also click, drag and scroll through frequencies using the waterfall display.

Changing frequency in SDR#
9. Changing Modes: click bubbles labelled AM, NFM, WFM, USB, LSB, CW at the left panel to change the mode in which data is demodulated by the software. For receiving transmissions from NOAA satellites, Choose WFM or "Wide FM".

Selecting modes in SDR#
10. Adjusting Bandwidth: in the left panel, find the window for bandwidth; use your number keys or the small up / down arrows to increase or decrease bandwidth. For receiving satellite transmissions, select a bandwidth between 36,000 - 45,000 Hz.
11. Adjusting Volume: drag the Volume slider to increase or decrease.
If you are using CubicSDR for Mac, follow these steps:

@sophied decoding a NOAA satellite pass using CubicSDR and WXtoImg
1. Download and install CubicSDR.
2. Launch CubicSDR
3. In the dialog window select your dongle from the Devices list and click Start. For example, for the RTL-SDR dongle select "Generic RTL2832U OEM :: 00000001".

CubicSDR Dialogue window
4. Click Sample Rate and select the correct sample rate for your dongle. The sample rate for the RTL-SDR dongle is 1.92 MHz.

Sample Rate menu in CubicSDR
5. To check CubicSDR is working, click anywhere on the bottom waterfall.
The default settings for Cubic SDR are:
| Setting | Default |
|---|---|
| Modulation type | FM (Frequency Modulation) |
| Demodulation frequency | 100 MHz |
| Bandwidth | 200 KHz |
| Audio out | You computer’s default audio output |
6. Tune to a frequency. There are three easy ways to tune to a frequency in CubicSDR
- Under the label 'Centre Frequency', click on the upper and lower parts of the numbers.

Tuning to a frequency in CubicSDR
- Click on the lower waterfall.
- Begin typing a number. A pop-up window will appear. Complete typing the frequency you want and, on your keyboard, press Return. Remember, the default until is Megahertz, always written as MHz. Megahertz is a unit of frequency equal to one million hertz.

Frequency pop-up window in CubicSDR
7. To change "Modulation type" or modes, on the top left select AM, FMS, NBFM, AM, LSB, USB, DSB, I/Q. NOAA satellite transmissions are FM, which is the acronym for Frequency Modulation.
8. Adjust the bandwidth. Under the label Bandwidth, click on the upper and lower parts of the numbers.
9. Adjust the audio output volume. In the top left, click and drag the vertical green bar.
10. Select the audio output: click the audio-out dropdown in the top left corner and choose your virtual audio device that you previously setup. In @sophied 's case this is "Soundflower (2ch)".
CubicSDR can freeze when quitting. When this happens, right click on the CubicSDR icon and Force Quit.
Step 4: Set up WXtoImg, your satellite decoding software
1. Download and install WXtoImg.
When you first launch WXtoImg, you will be taken through a series of steps to tailor the software to your computer. Go through the steps. Then follow the instructions below.
2. Assigning your Ground Station Location. Select Options > Ground Station Location (you can either search for a city or input your latitude and longitude manually)

Ground station location in WXtoImg
3. Update Keplers. Select File > Update Keplers (It is good to update Keplers before every satellite decoding session to maintain accuracy) (the computer must be connected to the Internet for this to work)
4. Adjusting the Map Overlay settings. Select Options > Map Overlay Options
5. Adjust the Recording Options: Select Options > Recording Options
- In the dialogue box that appears, select your chosen virtual audio cable. Select Soundcard > [Your Virtual Audio Cable]
- Choose 11025 as the sample rate.
- Input elevation settings for receiving satellite signals; Tip: good settings to begin: maximum elevation above 9 degrees; record only when satellite is above 8 degrees.
- Select what kind of antenna you are using from the Antenna Type list. See image below for recording settings employed by @sashae:

WXtoImg: Recording Options Dialogue Box
6. Checking the Satellite Pass List: Select File > Satellite Pass List. This will generate a window with upcoming times at which NOAA satellites will pass over your ground station location)
Step 5: Test that WXtoImg can 'hear' your SDR software
1. Tune to an FM radio station (around 100 Mhz) using your preferred SDR software
2. In WXtoImg, Select Record > Manual Test.
3. Do lines filled with tiny dots or speckles start loading in the WXtoImg window? If so, WXtoImg can hear your radio software and the audio connection is working.
WXtoImg attempting to decode FM radio static
4. In the bottom right, is the volume level green? If it is 'in the green' this means the signal is in a good range for decoding. If it is not green (e.g. if it is red or yellow) adjust the volume on your SDR software until the WXtoImg volume becomes green.
Step 6: Decoding an image from a satellite pass
Important to know:
When is the next 'good' satellite pass over your location?
A 'good' pass is a pass that is more than 10 minutes long. In the Satellite Pass list, Duration is measured in minutes. In the Satellite Pass list generated by WXtoImg, find the next 11+ minute pass.

Satellite pass list in WXtoImg
What direction is the satellite traveling?
In the Satellite Pass List, note whether the satellite is Northbound or Southbound. Also note whether the satellite will be to the east or west of you, and at what maximum elevation. For example: a NOAA 15 Southbound pass at 49W MEL (Maximum Elevation) means the satellite is traveling south and at its max elevation (mid way through the pass) it will be 49 degrees out of 90 (where 90 is directly overhead) to the west. This means that mid way through the pass, if you are using a Turnstile antenna, you should be aiming your antenna diagonally upward to the west at a 49 degree angle. If you are using a V-Dipole antenna like that in the "RTL-SDR v3 with the V-dipole antenna kit" you should keep the antenna parallel to the ground with a north-south orientation (and the two antenna 'ears' 120 degrees apart both facing South).
What frequency will the satellite be transmitting on?
Make sure to note down the frequency of your chosen satellite pass (see the rightmost column in the Satellite Pass List where Frequency is listed in Mhz).
Where can you best receive this transmission in your local area?
The transmission is best received from a wide open area with a good horizon. This could be a park, a parking lot, a rooftop, a hill, a beach or a balcony (as long as the balcony has a clear view of the path of the satellite)
Pre-satellite pass checklist
- Are you tuned to the frequency of the satellite?
- Are you using a 36,000--45,000 Hz bandwidth and demodulating with FM (CubicSDR) or Wide FM (SDR#)
- Is your SDR software sending audio to WXtoImg (see above steps for testing that they can hear each other)?
- Are you pointing / orienting your antenna in the right direction?
In SDR# the waterfall display can freeze or stutter. If this happens simply close the programme and reopen it, keeping your dongle plugged in.
Receiving your first satellite transmission
1. A few minutes before the pass is due to start. On WXtoImg Select File > Record > Auto Record; When the satellite passes over the elevation you designated in the Recording Options dialogue box, you should start receiving a signal.
2. The satellite signal looks like a faint series of dots and dashes that will begin to appear on the waterfall display of your SDR software;

Traces in the SDR# waterfall display
3. When you see the satellite signal, adjust the frequency (if needed) so that the SDR / radio software is centred on the signal. This might mean increasing the frequency 1 or 2 MHz
4. Adjust for the Doppler shift. The frequency of the transmission 'drifts' from a little higher than the satellite's designated frequency to a little lower than the designated frequency. During the pass adjust for this Doppler shift by using the arrows or dragging in the waterfall display to keep the radio software centred on the satellite signal.
5. If you are using a Turnstile antenna, remember to track the satellite as it orbits overhead. You can let the visible strength of the signal guide you. If you are using another antenna like a V-Dipole you need to pay attention to orientation: keep the antenna parallel to the ground with a north-south orientation (and the two antenna 'ears' 120 degrees apart both facing South).
You will see a marked difference in signal strength on the waterfall display if you are pointing the antenna in the right direction vs. the wrong direction.
6. Periodically check WXtoImg to make sure the volume is green and the pass is being decoded.

WXtoImg window: live-decoding a satellite image from NOAA 19
7. When the pass is over, WXtoImg will begin to automatically process the raw data. You will see the software 'working' as it combines information from different sensors to produce a series of b/w and colour images. When it is done processing 'Done' will appear in the bottom left of the window.
8. Stop WXtoImg from waiting for the next satellite by selecting File > Stop.
9. The image you have just received will be stored in the Raw Images tab. You can double click on the raw image of the pass and then use the Enhancements menu to look through the different combinations of sensor data.
10. The raw image and audio file unique to this pass will also be saved in WXtoImg's 'Raw' and 'Audio' folders on your computer.
Congratulations on your first attempt!

WXtoImg enhancements
Troubleshooting
My satellite decoding software loads a black image during the test
This means there is something wrong in the connection between your SDR / radio software and WXtoImg. You need to double check all of the connections and virtual audio cables. Double check the Audio Output on your SDR software and the Soundcard (Audio Input) in WXtoImg.
The volume is in the red, close to 0 during the test
This means that the signal coming into WXtoImg is far too quiet for WXtoImg to be able to process it. Turn up the volume on your SDR software. If this doesn't work there may be an issue with the audio inputs and outputs connecting the SDR software to WXtoImg.
On MacOS, check that the Master volume for Soundflower is not turned down.
- Application > Utilities > Audio MIDI Setup
- In Audio MIDI Setup, select Soundflower (ch2)
- Drag the level of the Master volume to the maximum value, usually 1
Alternative Guides for Decoding Weather Satellite Images
@sophied and @sashae have found many other useful guides during their attempt to learn how to decode weather satellite images. They found that reading different guides often clarifies different issues since authors put emphasis on different details in the process. These guides include:**
- RTL-SDR Tutorial: Receiving NOAA Weather Satellite Images
- Martin Bernardi's Guide to Receiving NOAA Images
- Alex Wuff's How to Download Live Images from Government Weather Satellites
If you have other issues, questions or concerns do ask a question on the #open-weather project page or get in touch with @sophied and @sashae.

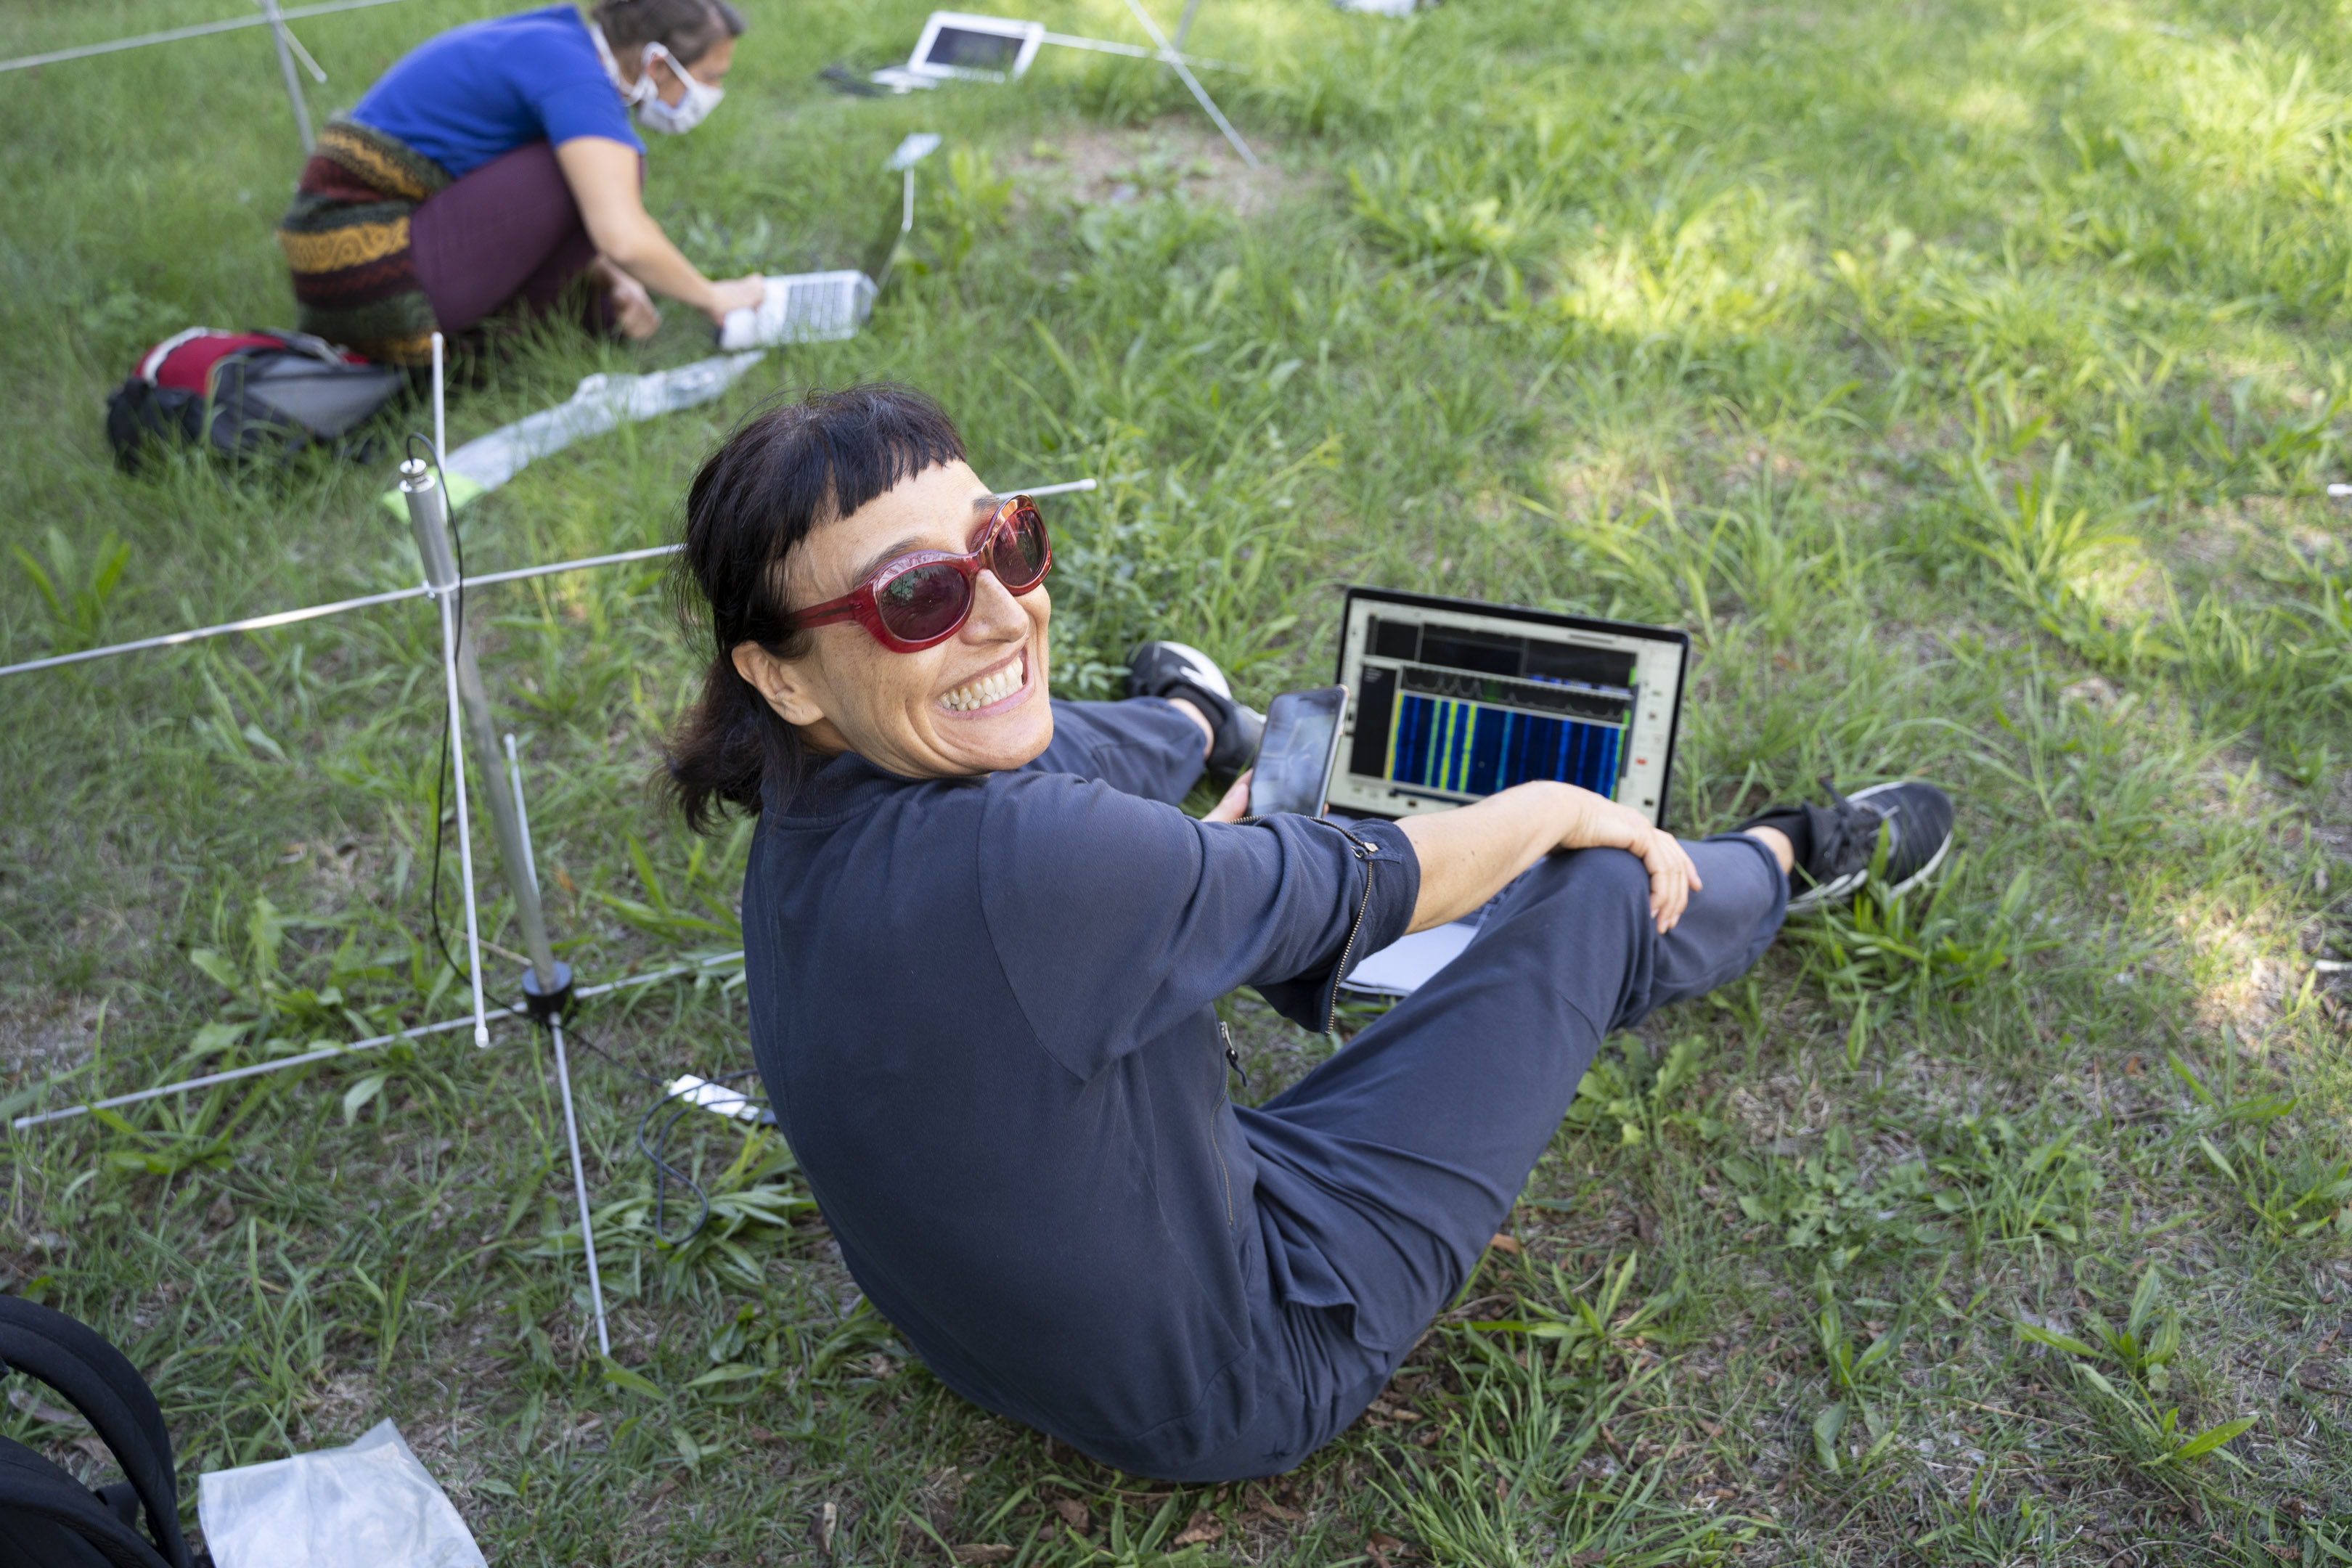
Catching a satellite, London, 2020
34 Comments
@ektopyrotic awards a barnstar to sashae for their awesome contribution!
Reply to this comment...
Log in to comment
@sashae has marked @sophied as a co-author.
Reply to this comment...
Log in to comment
Excellent. A really clear detailed explanation of how to get started. Some years ago I built a dedicated kit receiver for recording WX pictures. Unfortunately it is no longer supported and the software program in it became out of date as earlier satellites became silent and new ones were launched. I have installed all the relevant software you listed on my MacBook and dusted off my old home made QFH. Now just waiting for the SDR dongle to arrive so I can try it out.
One problem I found - downloading the WXtoImg dmg from the link you have resulted in a corrupt file which couldn't be run. I had to get it from a different site.
John (M1BTR)
Hi John! Thanks for your feedback on the guide. You're right- the link we had used for WXtoImg led to a corrupted download. We have amended the WXtoImg link so that it now leads to the WXtoImg beta download page, from which @sophied, myself and another first-user of the guide Zack Wettstein have successfully downloaded the software. Thanks for catching that! And do let us know how it goes when your hardware arrives.
I managed to find an RTL-SRD in the UK so I am set up and running. Everything working very well. I have my home made QFH on a 10ft pole in the middle of the garden. There must be at least 10m of RG213 from it to my MacBook indoors but I still get good results.
Virtually as good as I used to get with a dedicated WXsat receiver and a pre-amp many years ago. Back then the main problem was interference from pager transmitters on nearby frequencies. Thankfully they have disappeared from the airwaves.
Many thanks again for putting together this superb 'getting started' guide. I have written about my set up on my blog with a link back to here. Hope more people rise to the challenge. 73 John M1BTR
Is this a question? Click here to post it to the Questions page.
Congratulations John!! This is fantastic news. The image is great- I love when the satellites send images from over the Atlantic. Also your antenna looks excellent! If you have any tips for building QFH antennas let us know- @sophied and I are still working on our own. Thanks also for linking here from your blog :)
PS: here is an image I received with a portable set up the other day in Germany, where I'm based for the summer.
Is this a question? Click here to post it to the Questions page.
Hi Sashae,
I built my QFH using 5mm micro bore copper tubing. I noticed many build instructions on the net used elbow joints but I didn't fancy soldering those. Mine is made with two continuous lengths of copper pipe threaded through a length of plastic water pipe. I worked out the lengths of each section including the elbows and just bent the copper where needed.
Love that image of yours. As most of our weather systems come from the Atlantic it is more interesting to see what is on the way. I don't get a clear enough line of sight to get N Africa included. I will probably set the QFH permanently higher up now I know it all works.
It's a shame the old Russian polar orbiters are no longer operational. They gave a bit wider view on each pass, though only in daylight if I remember correctly.
Hope to see more people writing about their experiences setting this up. 73 John M1BTR
Hi John, thanks for the tip on QFH antennas. It's good to know one can make one without soldering. Also, do you know about the Russian Meteor fleet? You mention that the old Russian polar orbiters are no longer operational, but the Meteor fleet is operational, and there have been several guides published on how to decode images from these sats. The Meteor images are also markedly higher resolution (400m / pixel) than those of NOAA sats (4km / pixel). The process is a bit more involved and technical than decoding NOAA sats but your QFH would work perfectly. In case you want another challenge here is a good resource: http://happysat.nl/Setup_Meteor/Setup.html 73's Sasha M6IOR
Is this a question? Click here to post it to the Questions page.
Hi sashae, I had a read through what is needed for receiving Meteor images but it looks as though much of the software is Windows only.
BTW I have used two different RTL-SDR dongles and can confirm what some others seem to have found. The genuine original in a silver coloured aluminium case is good with reasonably low noise. The cheaper black cased one I tried is very noisy. Perfectly suitable for strong local signals but poor with weaker signal from spacecraft. Worth paying the extra to get good results.
I found a length of RG214 (silver plated copper and thick shielding). I replaced half my long run with that and can see in improvement in received signal. Always room for improvement.
73 John M1BTR
Thanks for the update John! You're right about the Meteor decoding software. I ended up partitioning my Mac because so much SDR software seems to be Windows only. I'll keep an eye out for any Mac developments.
Also thanks for the confirmation of the performance of the RTL-SDR original dongle vs. others- @sophied uses the original silver-cased RTL-SDR and I use a Funcube dongle pro +. It's always interesting to hear how different dongles compare.
Reply to this comment...
Log in to comment
Hello, today i took my first images with a dipole antenna, I had good results with NOAA 18 satellite but bad with the others. Here is an image of NOAA 19.
I would appreciate if you could help me to find out the problem.
Thank you.
Is this a question? Click here to post it to the Questions page.
Hello @usere6020 - what do your results from NOAA 18 look like? Are you getting clean images from NOAA 18, or are they also noisy?
From the quality of the image you have attached, it looks like WXtoImg is receiving information to decode, but it is not able to distinguish the APT signal clearly enough. Your image looks somewhat like what would happen if WXtoImg were asked to decode white noise on the radio spectrum. Some points to check would be:
Let us know how you get on!
Is this a question? Click here to post it to the Questions page.
Reply to this comment...
Log in to comment
I did this! Thanks so much, [@sophied](/profile/sophied) and [@sashae](/profile/sashae) for this inspiring, thorough yet accessible guide. I've been using the based SDR/dipole antenna you referenced and the process you've outlined below to capture some intriguing satellite imagery this past month. We're in the midst of a heat wave here in the Pacific NW and I've been decoding imagery this week and watching the sea- and ground-surface temperatures varying along the way.
The only thing I will add is that if you opt for the basic V-dipole antenna, I found a few sources elsewhere to help orient the antenna -- from what I've read (and now through experience myself), you can get quite good reception placing the two dipoles 120 degrees apart and extended to 54.5m to achieve the (quarter) resonant length for the roughly 137.5MHz frequency. If you drew a line at the midpoint of the two dipoles (so 60-60 degrees), I have that pointing due South (in the photo below, to the left). The V-shape is parallel to the ground and I use the included tiny flexible tripod.
I've attached a few photos (sorry the resonant length is wrong in my photo!) and with this setup have achieved quite decent signals and SNR between 20-40 when there are no obstructions in the sky, at satellite elevations greater than 40 degrees.
I've also included a few captures from this evening. Thanks again! Looking forward to more from #open-weather
Is this a question? Click here to post it to the Questions page.
Congrats @zwettstein ! Your tips for using a v-dipole are really clear and helpful. Nice sea-surface temperature photos too. Happy to have you involved in #open-weather!
Reply to this comment...
Log in to comment
@todgobblins awards a barnstar to sashae for their awesome contribution!
Reply to this comment...
Log in to comment
Would TROPOMI (TROPospheric Ozone Monitoring Instrument) http://www.tropomi.eu/ be a satellite that data could be pulled down from in this way? Accessing these images right from these census tracks covered in this story about #houston would be a powerful public science action: https://cen.acs.org/environment/pollution/Satellites-see-air-pollution-inequality/98/web/2020/08 ...
Is this a question? Click here to post it to the Questions page.
Hi @liz, as far as I can tell the Sentinel-5P spacecraft carrying the TROPOMI instrument transmits on the S and X-bands to the ESA ground station in Kiruna, Sweden. While this satellite is similar to NOAA sats in the sense that it is in low earth sun synchronous orbit at 824 km and it circles the earth every 101 minutes, it differs in its downlink frequency and quality, which has big implications for what kind of hardware / software one needs to receive a transmission. To compare, NOAA satellites transmit on the VHF part of the radio spectrum at 137 Mhz, but Sentinel-5P transmits on the microwave (2-4 Ghz) and 'super high frequency' (over 7 Ghz) part of the spectrum. From my understanding of these high frequencies, receiving such a transmission would require a completely different kind of antenna and set up to a turnstile or v-dipole which is what we use in the DIY Satellite Ground Station Guide. This is one kind of X-band antenna for example:
I need to do more research on this as I think there are other antenna options and some radio amateurs do communicate with Cubesats on the S band, I think. We would also need to figure out how to decode the data (it might be encrypted). Just some beginning thoughts. More soon!
Is this a question? Click here to post it to the Questions page.
Thank you so much for showing how to think through this question @sashae 😃
Reply to this comment...
Log in to comment
Hey @midmarsh @nearsys @zwettstein and @usere6020:
I wonder if you would be interested in participating in a global weather 'nowcast' ? @sophied and I are collecting images generated by open-weather collaborators and contributors recorded from NOAA satellites on Sunday September 6th 2020 in order to stitch them together into a global weather 'composite' - like a giant collective weather-map. The weather 'nowcast' will be linked to the OurNetworks festival starting on September 8th, and @sophied and I will discuss the 'nowcast' during the festival programme on September 12th at 2:30pm UTC-4 (ET). We will also publish the nowcast here on Public Lab along with some reflections on the methodology and learning outcomes.
Since you four were early adopters of the DIY Satellite Ground Station Guide, we'd love for you to take part! All contributions will be full credited and attributed. If you're up for this let me know :)
Here is an early 'demo' for the nowcast.
PS here is a link to the OurNetworks festival: https://ournetworks.ca/
Is this a question? Click here to post it to the Questions page.
I would like to try.
On Tue, Aug 25, 2020, 6:17 AM \<notifications@publiclab.org> wrote:
Is this a question? Click here to post it to the Questions page.
Awesome @nearsys ! that's great news. All you need to do is record / decode a NOAA satellite pass on 6th September and submit the images and sounds to the open-weather archive (via a link that I will share with you before the 6th).
Hi @nearsys and @zwettstein (@midmarsh and @usere6020 too), Thanks for your willingness to contribute to the open-weather global 'nowcast'. Here is a link to a form where you can submit your materials to the open-weather archive for purposes of co-producing the nowcast. As I mentioned earlier, all you need to do is record / decode a NOAA pass from your ground station location on Sunday September 6th, and submit the results through this form. All contributions will be fully credited. Please let me know in the event of any questions or issues!
https://forms.gle/wP1yw1bXbux4rR6A7
Dear @nearsys and @zwettstein (@midmarsh and @usere6020 ) here is the result of the open-weather community nowcast on September 6th 2020. Thanks especially to @nearsys and @zwettstein for participating with beautiful imagery from the American Northwest!
You can explore the full nowcast and all original contributions at: https://open-weather.community/
@sophied and I will soon publish a research note on our community nowcast methodology
Is this a question? Click here to post it to the Questions page.
Reply to this comment...
Log in to comment
For Linux/Raspberry Pi, there's a great Instructable at: https://www.instructables.com/id/Raspberry-Pi-NOAA-Weather-Satellite-Receiver/. Uses 'cron' to update the TLE's, 'predict' to schedule the satellite passes, 'rtl_fm' to read the SDR, and 'wxtoimg' to create the images. Runs nicely on a Pi3+
Is this a question? Click here to post it to the Questions page.
Thanks @solaria ! This is really good to know. Also the image you have posted is incredible. It reminds me of this image that @zwettstein posted online last week, similarly showing clouds of smoke off the Pacific coast. https://twitter.com/zwettstein/status/1304824423388651520
Looks like the zwettstein image is NOAA 15 2020-09-12. I have a capture of that pass, but it's noisy. Aligning the time marks, it's interesting that both images have similar noise features, but offset by half a second(correction: half a minute):
Hour and a half later, NOAA 18 came up. The land detail is nice:
Is this a question? Click here to post it to the Questions page.
Woah! That is really interesting @solaria ! Have you encountered this kind of interference before? Do you know of other documentation of Starlink satellites interfering with NOAA and other low-earth-orbit sats? Would be really interesting to know more...
Is this a question? Click here to post it to the Questions page.
Well, probably not Starlink (>14.0GHz), but there are other satellites in this band. I generated a heatmap (using rtl_power) on 137.000MHz - 137.999Mhz for 15 minutes, ran the results through heatmap.py and got this:
That's NOAA19 at 137.100MHz, and ORBCOMM satellites at 137.290/137.740MHz and 137.250Mhz/137.310Mhz. No interference there.
Notice the Doppler Shift of the satellite frequencies as they fly by...
Is this a question? Click here to post it to the Questions page.
This is fascinating, thanks for sharing!
Reply to this comment...
Log in to comment
Are these same images available directly from NOAA in any way, or is receiving them Over The Air the only way to get them?
I'm wondering what else you can receive from satellites!? Reminds me of when people watched news TV satellite feeds to discover secrets.
Is this a question? Click here to post it to the Questions page.
Hi @pdhixenbaugh thanks for your question. In my basic understanding, you can 'place an order' for NOAA images and datasets through their data stewardship system. The specific NOAA satellites we are engaging with in the #open-weather project (NOAA-15, NOAA-18 and NOAA-19) collect data through the Advanced Very High Resolution Radiometer (AVHRR) instrument. You can access data from the AVHRR on board NOAA-18, NOAA-19 and NOAA-15 and 'place an order' for your chosen dataset here: https://www.bou.class.noaa.gov/saa/products/search?datatype_family=AVHRR Having never placed an order for these datasets I cannot speak to how they are sent to individuals nor whether there are limit to the amount of data one can 'order'. Hope this helps in a small way!
Is this a question? Click here to post it to the Questions page.
Reply to this comment...
Log in to comment
Hi ! Thanks a lot for your tutorial, it's really great ! I tried some acquisitions with a V-dipole and this is what I obtained:
I've enjoyed doing this!
Is this a question? Click here to post it to the Questions page.
Hi @QuentinP these are wonderful results - beautiful imaging of weather systems over Spain and France! Glad you found the tutorial useful.
Fantastic, and great images @QuentinP!
Are you using WXtoImg? Maybe you already know this but, if WXtoImg cropped your image, and don't want it to: go to the "Options" menu and select "Show All" to reveal noisier top and bottom of the image.
Is this a question? Click here to post it to the Questions page.
Reply to this comment...
Log in to comment
Login to comment.