_Image courtesy of _
Purpose
This activity was developed for the Oil Testing Kit Beta Challenge last winter. The basic hypothesis is that different grades (molecular weights) of oil will have significantly different fluorescence spectra, such that an oil type could be distinguished by the maximum intensity wavelength and range of its fluorescence. The purpose of the challenge was to test this hypothesis, and specifically to:
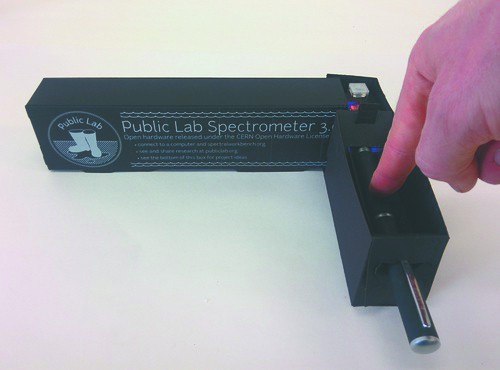
assess whether or not the PL v3 desktop spectrometer (with cuvette holder addition) could collect visibly distinct spectra for five different grades of oil,
assess whether or not spectra of oil samples captured with PL v3 desktop spectrometers were consistent across multiple spectrometers,
people could use their PL v3 desktop spectrometers to categorize unlabeled oil samples.
Our goal was to have at least 20 people replicate this activity and compare their results. Yagiz Sutcu conducted an analysis of the reproducibility of spectra, which I will try to attach in the comments section. The basic results indicated that spectra collected with different spectrometers (and by different people) were not consistent enough to allow for direct comparison. Replicate scans of individual samples using individual spectrometers were fairly consistent, but even that variation was large enough to inhibit proper categorization of certain unlabeled samples. It would be great to increase the number of replications for this activity, however, and to have more thorough documentation of experimental conditions that may have impacted results. Please try to replicate this and add your results for comparison!
Materials Needed
The materials needed for this experiment are detailed in the oil testing kit wiki. They include:
- PL desktop spectrometer v3 (see construction instructions here)
- oil testing kit cuvette holder attachment
- attenuation strip
- mineral oil
- sample oils (sent directly from Public Lab's office in Portland, OR)
- 405 nm Blue Ray laser
- computer with USB port
- Spectral Workbench (https://spectralworkbench.org)
Experimental Conditions
In order to best be able to compare results, please include descriptions of the ambient conditions when you collect your spectra. Important notes may include:
- whether or not ambient light may be entering your spectrometer, and if so, what kind of ambient light it is
- whether or not there are any visible deformations of the spectrometer or cuvette holder (such as bowing)
- any modification of hardware (such as inserting a wooden lift to better align the cuvette and spectrometer
- any variation from the ideal 90-degree angle between spectrometer and oil testing kit addition
- whether or not you are using the attenuation strip, and if so, at which level
- any potential oil sample cross-contamination
- any potential sample dilution
General Tests
Following the procedure detailed below, please be sure to conduct parts A and B summarized here, and parts C and D as much as you are able!
A. Documenting known samples 1. Take triplicate scans of each known sample, and label the scans as stated in the Procedure below. 2. Make a set from your triplicate scans of a given sample. 3. Analyze and post results, as described in the Procedure.
B. Investigating unknown samples 1. Take triplicate scans of each unknown sample, labeling the scans appropriately. 2. Make a set from your triplicate scans. 3. Analyze the results. 4. Compare the results against the suite of known samples you have already analyzed. 5. Post your results, along with your assertion of which kind of oil comprised each unknown sample.
C. Further Investigations 1. Try diluting samples using mineral oil, recording the dilution factor (e.g. 1 mL oil sample + 3 mL mineral oil = 4 mL total, and a dilution factor of 4), and analyzing the diluted sample as described in the procedure above. How dilute can a sample be and still be detectable and discernible? 2. Try mixing oil samples and analyzing the resulting mixtures. Are their spectra additive and discernible as such? 3. Try other fun things!
D. Share your thoughts 1. Provide ongoing feedback about the oil testing kit, including hardware, software, and programatic aspects. 2. Utilize Questions, Research Notes, the Spectrometry google group, and wiki editing to communicate and exchange knowledge.
Procedure
- For each analytical session, make a white light calibration scan, and use that to calibrate each scan performed in that session (see instructions here: http://publiclab.org/wiki/spectral-workbench-calibration).
- Scan a cuvette filled with just mineral oil to confirm a "negative" result, and name it "Mineral oil". (Be sure your mineral oil does NOT have vitamin E additives, as some baby oils do -- this will produce visible fluorescence)
- Scan each of the 5 labeled and 3 unknown samples in your Beta package on Spectral Workbench.
- Take triplicate scans of each sample and label them
OTK_(sample#, e.g. 20W50)_a,OTK_(sample#)_b, etc. - Ensure the appropriate intensity range using the attenuator strip (i.e. ensure that the red, green, and blue lines do not max out intensity, which will make it impossible to correctly identify the maximum peak wavelength).
- For darker samples, you may need to dilute using mineral oil, which should (as you demonstrated in step 2) not produce any fluorescence. The crude oil sample is very dense -- just one drop of it in mineral oil may be sufficient. Remember to note any dilution, with # of drops or ratios, in the spectrum description! Read more about dilution here
- In the notes section for each scan, record the excitation source used (e.g. Blu-Ray 405 nm laser), any attenuation, any dilution done, ambient lighting conditions, and any other relevant information, such as changing styles of cuvettes or a different webcam connection.
- Tag each scan (including the mineral oil) with
oil-testing-kit, and your unknowns withunknown - Run the "Auto smooth" macro in the "More Tools" menu (shown below) on each spectrum.
- Add all your scans of one sample type to a set.
- Use the "Equalize area" button below the graph on the set display page
- Use the "Find graph 'centers' only between 410-700nm" tool under "More tools" in the set display page
- Take a screenshot of the resulting graph and post it to this site as a research note along with a link to your set.
Verification and Trouble-shooting
Verification and trouble-shooting are vital parts of any procedure. Please add more trouble-shooting tips in the comments, since I know this list will be incomplete (and likely insufficient).
To verify that you have constructed the spectrometer correctly, first visually inspect it to ensure that the sides do not bow. Next, follow the steps to ensure you can capture and calibrate a spectra, detailed here.
To verify that you have correctly constructed the oil testing kit, ensure that the cuvette is held snuggly and vertically.
Please add further verification steps in the comments!
Trouble-shooting can be an arduous process. Common problems with spectrometer construction include:
webcam installation at an angle. This interferes with proper spectra collection in Spectral Workbench since the software assesses a horizontal line of pixels, which will be off-axis if the webcam is installed on a diagonal.
webcam connection to USB is disrupted. This connection can be finicky. If you don't see any spectra at all, check to ensure that the cord is still plugged in to your webcam.
ambient light entering spectrometer due to bowing side walls. If the folds you make are not deep enough and precise enough, the spectrometer side walls can bow out and allow for ambient light to enter. This obscures the spectra because it disrupts the angle of incident light (which should only be coming through the narrow slit on the front side), and the spectra will appear blurry.
the angle between the spectrometer and the laser (via the cuvette) is not 90 degrees. Since fluorescence is properly observed at a 90-degree angle so as to avoid measuring incident light, your spectra can be drowned out by incident light if it is closer to 180-degrees, or have very low intensity of it is less than 90-degrees. If you observe a peak in your fluorescence spectra at the wavelength of the incident light (~405 nm in this case), you are likely not at 90-degrees.
the spectrometer slit and fluorescence from cuvette are not aligned by height. If you see no fluorescence spectra, it may be that the height of the spectrometer slit is above the height of the oil sample, such that the slit does not receive any fluorescent light. Try filling up the cuvette with more oil, or using a small platform to lift the height of the cuvette to be aligned with the spectrometer slit.
Please add more trouble-shooting tips in the comments!
Discussion
Yagiz started a great discussion of the results of the Oil Testing Kit Beta Program with his report, attached below. Please read and comment, and discuss your own experience and ideas too!
2 Comments
Looks like Yagiz report is missing. re-attach?
Is this a question? Click here to post it to the Questions page.
Reply to this comment...
Log in to comment
Here is Yagiz' report, also linked from his site: https://sites.google.com/site/yagizsutcu/ OTK_Beta_Program–Data_Analysis.pdf
Reply to this comment...
Log in to comment
Login to comment.