Lead image: by Lauren Manning, CC BY
Purpose
Storytelling can be an effective way to turn environmental data into an impactful message. This activity outlines key steps a group can do together to create a "data story" for their community science data.
Check out the question that prompted this activity here: https://publiclab.org/questions/bhamster/11-08-2021/what-is-data-storytelling-and-how-can-it-be-used-for-environmental-data
Materials needed
- Blank paper, sticky notes, pens, markers, and pencils for outlining ideas and sketching storyboards with a group
- A computer or tablet for accessing data, creating visualizations
Steps
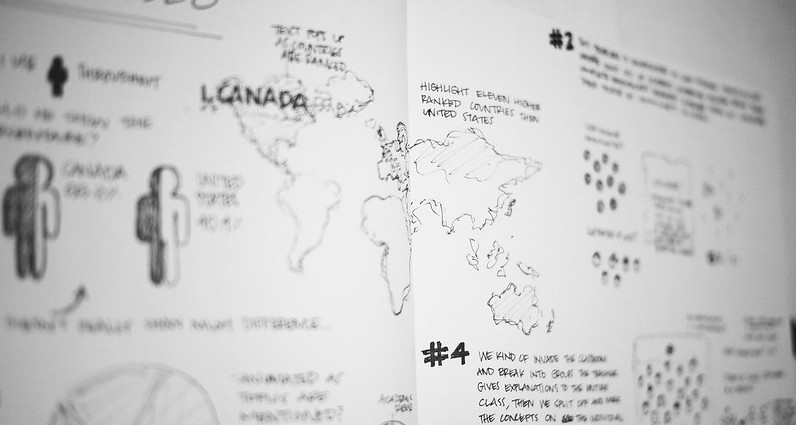
Image: infographic of steps in creating a community science data story, by @renee.
Image: infographic of key elements of telling a data story, by @renee.
Wrap up
- Comparing data visualization tools: this research note by @fongvania features a collaborative table of different data viz tools--head here when you're ready to choose a tool.
- Share your data story and visualizations with the Public Lab community! You can comment below, or post a research note!
- Have ideas for improving this activity? Please comment below!
References and additional resources
- "Start Sketching Your Data Story," from the open-access web edition of Hands-On Data Visualization: Interactive Storytelling from Spreadsheets to Code, by Jack Dougherty and Ilya Ilyankou.
1 Comments
@bhamster has marked @renee as a co-author.
Reply to this comment...
Log in to comment
Login to comment.