Hi,
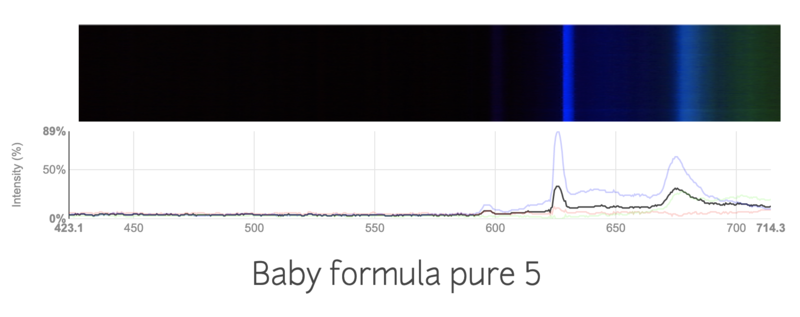
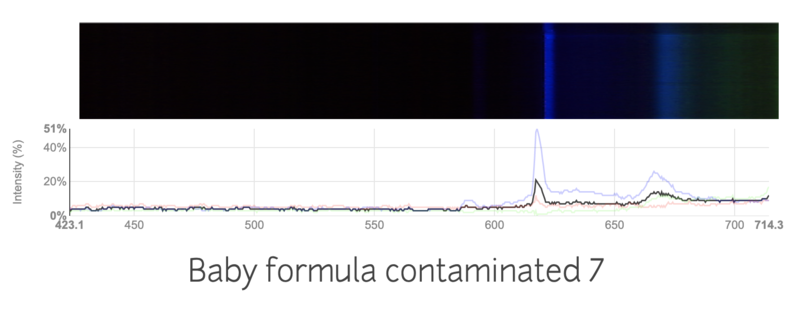
I wanted to do a project using the Public Lab spectrometer, and detect contamination in baby formula. Baby formula has previously been contaminated with melamine, which increases the nitrogen content of the milk. To mimic this, I added nitrogen fertilizer to the formula. I took a couple spectras, shown below.-><--><--><--><--><-

This is the spectra of a regular baby formula

This is the spectra of baby formula mixed with a large amount of nitrogen fertilizer.
I had a couple questions about the viability of the project.
I tried my best to keep the conditions the same, like the distance from the light source, thickness of the formula. I'm not sure if the change in spectra is just due to inconsistencies in my work, or if the spectrums are truly different. Are these spectras accurately showing the contamination in the formulas?
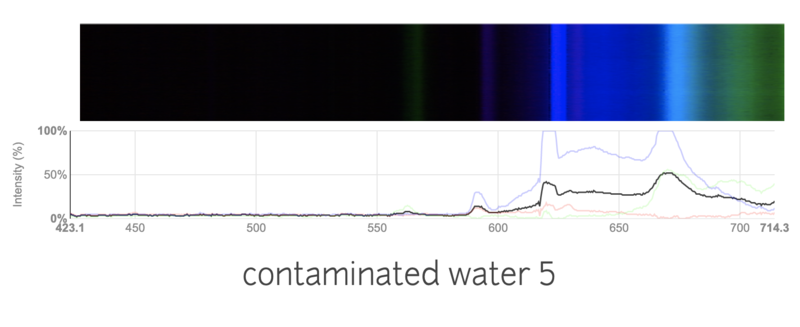
I was also curious and wanted to try to detect nitrogen contamination in regular water. I've attached the spectras below.

This is a spectra of plain water

This is a spectra of water with a lot of nitrogen fertilizer added.
I was really surprised to see such a big difference in the spectras! I was a little confused, as I thought it was hard to detect water contamination through a simple spectrometer. I added a lot of fertilizer, so maybe that was the problem? I am wondering if these results make sense, or are just flukes. Do you think it would still work if I added a more realistic amount of fertilizer?
I would love any advice on what you think!
Thanks so much!
That's interesting. I wonder why there is such a difference in the gradient for the nitrogen water. Also interesting that the contaminated milk spectra is much fainter. Reminder me what the black red blue lines are again?
Is this a question? Click here to post it to the Questions page.
Reply to this comment...
Log in to comment
@kgradow1 awards a barnstar to akhila for their awesome contribution!
Reply to this comment...
Log in to comment
Hi, @akhila - this is a really cool experiment you're doing! OK, i think i may have some suggestions that could help;
I'd say maybe the ideal next steps would be to get your setup to the point where you are seeing a really consistent spectrum over 5 or more scans of plain water, and to then make a set of scans of your sample, once you figure out the doubling issue. It's always better to average a few scans to ensure you're getting repeated, consistent results, and not just some random reflection or fluke. Then we can really start to measure the difference.
Great work so far! Keep it up and tell us how it goes, we can help troubleshoot more as well!
Is this a question? Click here to post it to the Questions page.
Thank you so much for your response, it was really helpful!
Reply to this comment...
Log in to comment
Ok guys,I'm used to commercial instruments. So these scans always throw me. First, if you are trying to compare concentration in the commercial world, this is almost always done in the absorbance mode, not the linear mode (these scans show linear scales). This is because of Beers Lambert s law (sounds better than it is) that says concentration is usually proportional to absorbance. And almost always background scans are run to take out the effects of routine environmental differences. Would this take too much extra software? Calibration used to be done with holmium oxide glass. That is probably hard to get a hold of in the correct thickness. At least for a decent price.
Sorry for the dumb questions.
Is this a question? Click here to post it to the Questions page.
Thank you so much for writing out this question -- as i am not from the commercial world, it's helpful for me to understand where different people in this conversation are coming from. Thank you!
Reply to this comment...
Log in to comment
Yes you're quite correct in an ideal world we would be using absorbance (Log of transmission) and subtracting a blank. There is also a problem with focusing in this experimental setup the sharpness of the spectrum will depend on the distance from the light source (is it optimised for infinity - I don't know). And, as I have mentioned previously, it's no good trying to quantify stuff that is colourless. Nitrogen fertiliser is either ammonium nitrate or urea both of which are colourless.
Thank you @David_Uwi
Reply to this comment...
Log in to comment
The usual way to solve the ammonium nitrate problem is to form a complex (that does absorb in the visible) and analyze the complex. Off the top of my head, this seems like a reasonable approach. But then again, I've done no investigation.
We did some work with developing a quick replacement for a lab analyzer. Please do not misunderstand. I did not program. But worked with the programmers. the program was dropped. Oh well.
Re:the ammonia problem- Amazon sells api ammonia test kits for fish tanks. The cost is under $7 for 130 tests ( be suspicious of this number, though). They show a color scale that the solution should change to( different shades of green). Hopefully, this could be modified to use the public lab spectrometer, although you would probably need a continuous spectrum source. You might be able to save money ( by using less volume)or get more accurate results- don't know. Hopefully this could be used for regular water. Any ideas?
Is this a question? Click here to post it to the Questions page.
Make sure you look for the liquid sample test ammonia kit, if interested. This is the one with a test tube and two liquids to add. The wrong kinds of kits have what looks like a pH strip for testing ammonia. The pH strip looks like it would take a lot more work.
You will need to tweak the method a little more, with volumes amounts of material added, etc. This should be viable for ammonium nitrate based materials. Some more head scratching is needed for the melamine based materials. The common approach is kjeldahl. A real pain method that is not always reliable. NIR has been used, also.
Reply to this comment...
Log in to comment
I m always learn ur post
Reply to this comment...
Log in to comment