
This tutorial shows you how to collect elevation data using the Emery Board survey method. Instructions on how to build the specific Emery Boards used in this application can be found here. This specific design was created in order to perform surveys in areas without a visible horizon line, such as swamps and forests.
Purpose
For this endeavor, we measured the spoil bank created following the construction of the Bayou Bridge Pipeline within the Atchafalaya Basin of Louisiana. Legally, pipeline companies are required to remove spoil banks because they restrict water flow, resulting in land loss and subsidence. Therefore, emery board profiles can be used to quantify how large the spoil bank is and can be submitted as evidence of bad acting by pipeline companies.
Scott and I teamed up with Atchafalaya Basinkeeper Dean Wilson to monitor the spoil banks and collect data that would illustrate a change in elevation from one side of the spoil bank to the other. The increase of elevation caused by excess materials deposited as a spoil bank has the environmental effect of disrupting water flow, causing harm to an ecosystem that supports Dean and the many other crawfishers and hunters who reside in the Basin.
The data collected during this activity was used in the recent lawsuit filed against Energy Transfer Partners (the group that owns the Bayou Bridge Pipeline) by land owners who had their property seized by ETP using eminent domain as justification. Elevation data and profiles created using the emery board method were presented to illustrate the negative impacts of spoil banks on the natural fluvial processes that sustain the Atchafalaya Basin. Coverage of this lawsuit can be found here, here, and here.
All data was collected on property where we had explicit permission from the landowner to access the site. If you are to attempt this method in a contentious area, make sure that you are operating legally and that you know your rights!
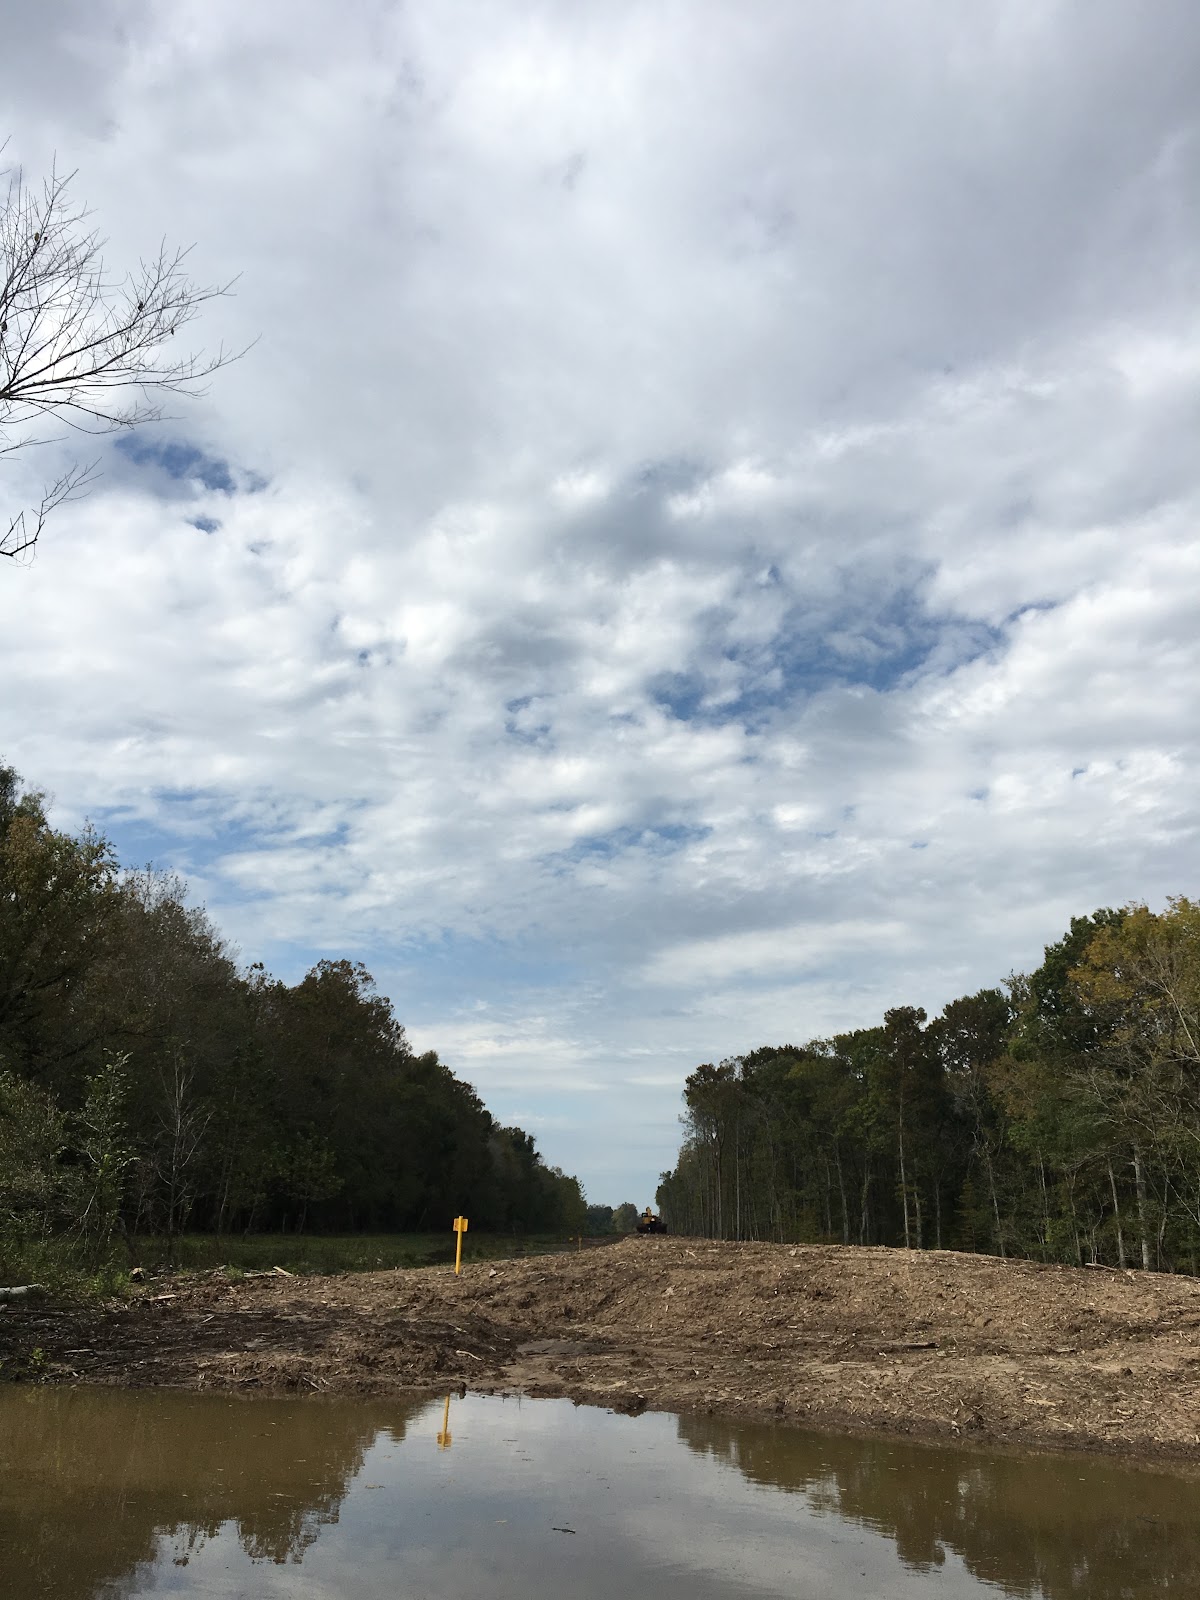
Figure 1. Looking parallel to the Bayou Bridge Pipeline: As you can see, the yellow marker denoting the location of the pipeline is feet below the maximum height of the spoil bank. Construction equipment can be seen in the distance.
Materials Needed
- Perform Survey
- Completed Emery Boards
- Measuring tape, or rope of known length
- Notepad
- Pen or pencil
- Compass (optional)
- Two or more participants
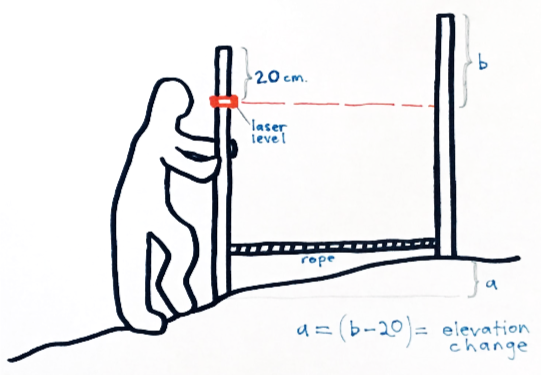
Figure 2. This illustration shows how to read a measurement off of the adapted Emery Boards.
For this walkthrough, we've assigned a name to each of the Emery Boards:
- The board to the left in the image above is the Base Board. The Base Board has the laser level attached and will always be lower in elevation than the reader board, so that the laser light does not shine over the top of the other Emery Board. This concept can become confusing when switching from ascending a hill to descending a hill.
- The Emery Board to the right in the image above is the Reader Board. For each data point that you collect, you will be looking for the laser beam on the Reader Board in order to determine the amount of change from one board to the next.
Steps
- Before going into the field: Look over existing aerial photographs and data of your site, taking notes of the coordinates for areas of interest. This can be done using Google Maps, for example, or if you are familiar with Geographic Information Systems, using high resolution elevation models. Here are some examples of where to find elevation data.
Select location for transect. The transect should cross cut a hill, dune, spoil bank, anywhere elevation changes.
Select a location that is devoid of objects in your walk path, such as trees, fences, structures, etc.
Mark approximate beginning, middle, and end point of transect. Alternatively, run a long tape from the starting point to the ending point of your transect and follow this tape during the survey
If moving uphill, place the Base Board (the Emery Board with the laser level attached) at the beginning of the transect, with the laser level towards the end of the transect. If your first measurement is moving downhill, switch the places of the Base and Reader boards so that the laser level does not shoot above the Emery Board.
Place your measuring tape, or rope, underneath your Base Board. Pull rope or tape to its full extent. Alternatively, if there is a steep elevation change that would not be recorded at the rope's full length, place the Boards at the site of the steep change. Be sure to document the actual distance between Reader Board and Base Board
Place Reader Board at the end of the rope. Make sure that the numerical sides of both boards are facing each other, and the laser level is pointed towards the Reader Board
Use bubble levels to ensure that both boards are level on the ground.
Turn on laser level. If laser is difficult to see, place your hand directly in front of it, and then walk backwards towards the Reader Board until the laser is visible on the Reader Board, as seen in Figure 3
Take note of: The centimeter closest to the laser beam on the Reader Board & the distance between the two boards. (If you consistently use the rope at its full extent, the distance should be the same throughout the survey.)
Once the measurement is completed, mark the location of the Reader Board and bring the Base Board to the exact spot that the Reader Board previously was.
Repeat steps 6 onward for as long as you are still ascending. Once descent begins, the location of the Reader Board and the Base Board will likely need to be inverted. If motion continued as it was while ascending, the laser would hit above the highest point of the reader Board.
Continue taking measurements until the end of the transect is reached. Double check to ensure that all elevation readings are within the expected range.
- Take note of: date, time, weather, participants initials, GPS coordinate of survey area

Figure 3. _Dean kindly helped us to locate the laser beam in order to collect measurements.


5 Comments
This is a wonderfully readable account of how to do this! Thank you so much for writing this up.
Reply to this comment...
Log in to comment
Update: the Emery Board has also been used to measure water depth around pipeline sites
Reply to this comment...
Log in to comment
Update from Naomi. This was a rush build, and crews were still out re-burying the pipeline in late September 2019. The pipeline has been pumping oil since April 2019.
Here are some notes from a field visit at low water, showing the hills left behind by construction https://www.healthygulf.org/blog/bayou-bridge-pipeline-field-notes
In this shot, the pipeline is buried under the orange marker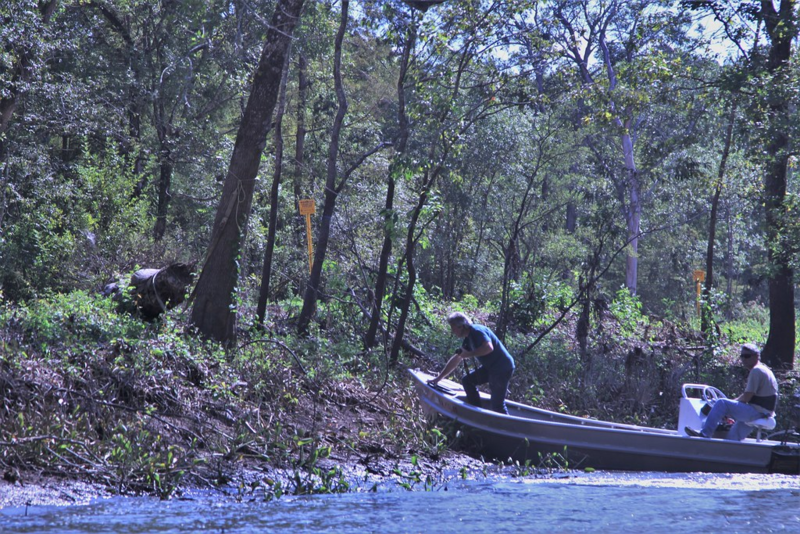
r t
Is this a question? Click here to post it to the Questions page.
Reply to this comment...
Log in to comment
Update from Naomi. This was a rush build, and crews were still out re-burying the pipeline in late September 2019. The pipeline has been pumping oil since April 2019.
Here are some notes from a field visit at low water (~5.8 feet at Bayou Sorrel Gauge), showing the hills left behind by construction https://www.healthygulf.org/blog/bayou-bridge-pipeline-field-notes
In this shot, the pipeline is buried under the orange marker. You can imagine how the emery boards would be useful here, for measuring the hill left after construction. If Dean, the guy with the camera, is 6 ft, you can imagine how the right of way, which Dean is climbing, has changed the flow of water into and out of the swamps.
Ivor stands in front of a spoil pile for Bayou Bridge Pipeline, for sense of scale. Ivor's kind of tall, and standing in front of the pile, which is higher. But you really need a simple survey method to measure things which are 10 feet in elevation difference, at most.
Scott
Is this a question? Click here to post it to the Questions page.
thanks for explaining this application Scott, i understand it better now. Thank you for all your work!
Reply to this comment...
Log in to comment
Login to comment.