Oil testing kit Blog

Some Gulf Coast Use Cases for the Oil Testing kit in 2015
What I want to do
I would like to describe some problems encountered in Southern Louisiana where having a visual Oil Testing Kit would be useful. Southern Louisiana is one of the 'sacrifice zones' for the oil industry on the planet. There are many places in Southern Louisiana where chronic oiling occurs, but the hazard has been determined a political problem, rather than an environmental problem. People living in such locations, by definition, lack political power to resolve the environmental problem. The personal testimony of oil hazards is often discounted. Oil and oil residue is often detectable by odor, but documenting odors relies on personal testimony.
Public Lab tools, specifically the oil testing kit, could be deployed to bolster community claims of oiling, and provide a new look into what are considered old problems and old news.
Oakville, LA vs Industrial Pipe
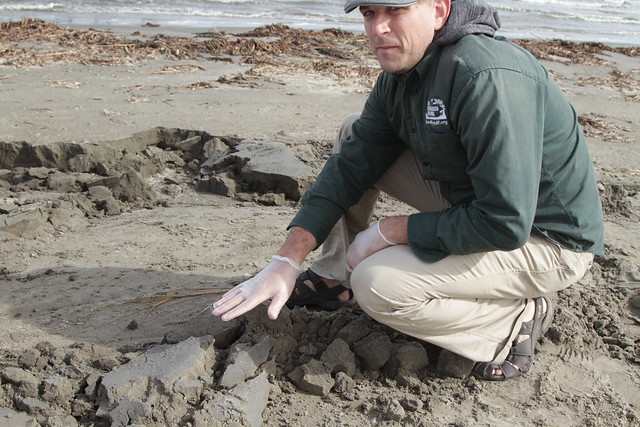
The town of Oakville, Louisiana is a half-hour outside of New Orleans in Plaquemines Parish. It is situated on the west bank of the Mississippi River, and was planned and populated in the era of Reconstruction. An industrial landfill has haunted Oakville's horizon since 1985, and remains an environmental hazard despite lack of official permits, court decisions, and political promises to close the site. The landfill is susceptible to coastal flooding that can disperse contaminants throughout the area.
While the focus has been on the immediate hazards of air pollution from landfill fires and reduction of waterlogged drywall into hydrogen sulfide gas, there is also oil sheen pollution on the waters of the Oakville ditch.
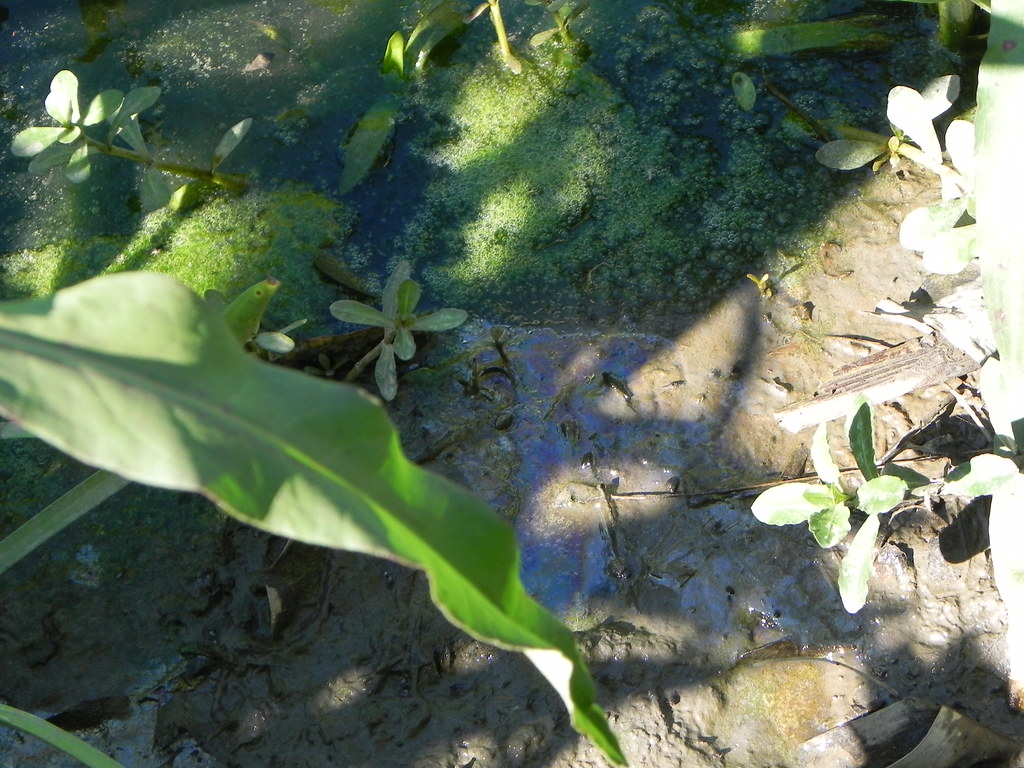
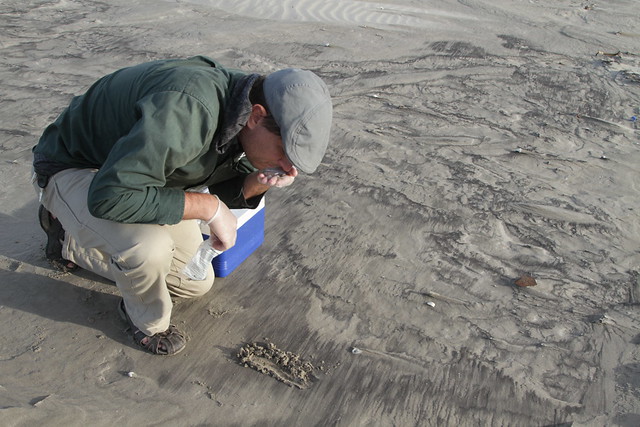
As the water in the ditch is shallow and highly turbid, water sampling often retrieves sediment, which has previously contaminated water sampling in the past.
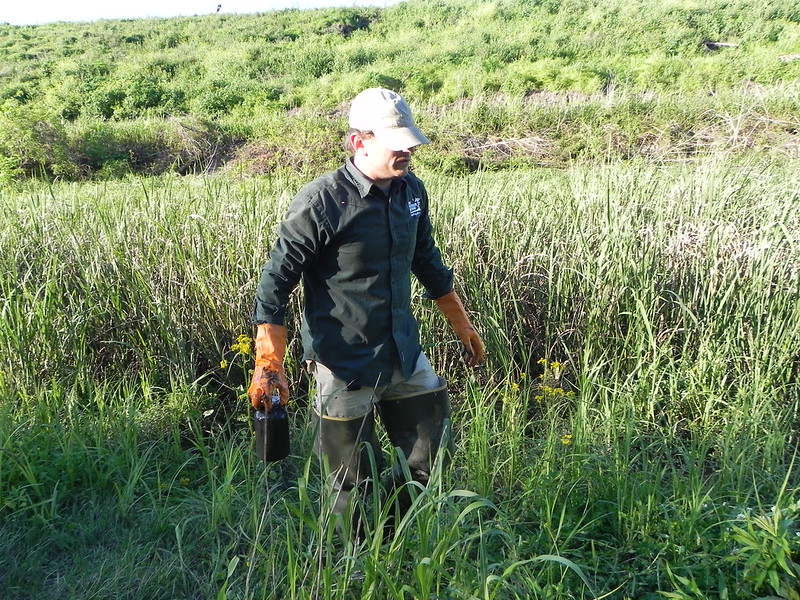
Photo album of previous TELC water sampling effort
The techniques for water sampling developed by the oil testing program are relevant to this situation, where water samples free from sediment are desired.
Water samples taken previously tested as heavily contaminated with oil and radioactive material associated with drilling waste[reference needed from CVD Pace results]. This was expected, as the recycling of "Industrial Pipe" involves washing crude oil and exploration wastes from used drilling pipe with water, which then is stored on the unlined landfill.
Although sheen is seen on the waters of the ditch, a likely argument from the opposing side will be that the oil is from local consumer sources, rather than leachate from exploration wastes running off the landfill site. Should the oil testing kit be able to discern crude oil from local, refined, consumer sources, it would assist community advocates in arguments against expanding the landfill, and arguments for more advanced testing of oil pollution on site.
Oil may also be found outside of the site, since the ditch is pumped into nearby wetland forests. Investigation into the pump outfall may reveal matching oil off site.
Central Questions: Is there oil in the ditch? Is there oil in the wetlands that the ditch is drained into? Is the oil in the ditch from crude oil, or from local consumer sources?
Grand Isle, Louisiana
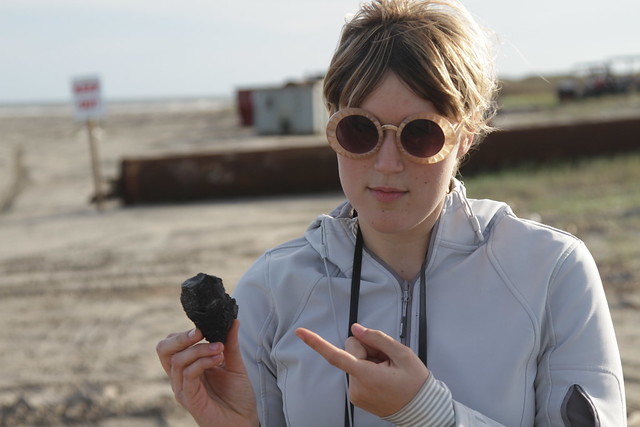
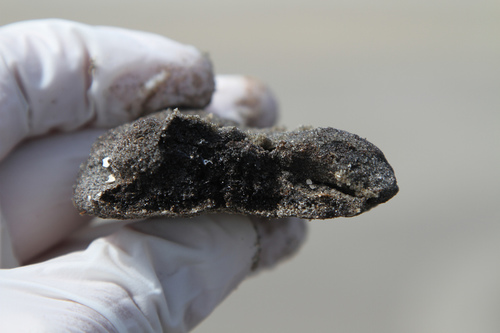
Grand Isle, Louisiana, two hours from New Orleans, is one of Louisiana's few beaches accessible by automobile, and so is marketed as a tourist destination. However, like many Louisiana beaches, the shore is littered with tar from thousands of oil spills. In addition to carcenogenic compounds, tar balls are known to harbor Vibrio, a human pathogen.
Sources of such tar include exploration and production in the inshore and offshore Gulf fields, but also the transportation of both refined and crude product. Testing less than 130 samples of tar on Louisiana Beaches by Overton et al from LSU for MMS revealed over 66 sources of tar, mostly from transportation sources. If such a situation is a baseline, how can we estimate the impact of BP's tar? Would we be able to detect an increase in tar from exploration and production, rather than transportation sources?
Tar Balls can be characterized by color, texture, sediment content, and a number of rough qualitative measures. In Alabama, Tar Balls of certain physical characteristics have been shown to be exclusively from BP's Deepwater Horizon disaster. How will spectra of Alabama tar balls be compared with spectra of tar from Louisiana, where we expect background oiling from Taylor and other wells to contribute to tar on beaches?
Photo album of Grand Isle Tar
Narrative of Tar witnessed on Grand Isle and Elmer's Isle
Tar on Elmer's Island (black, hardened)
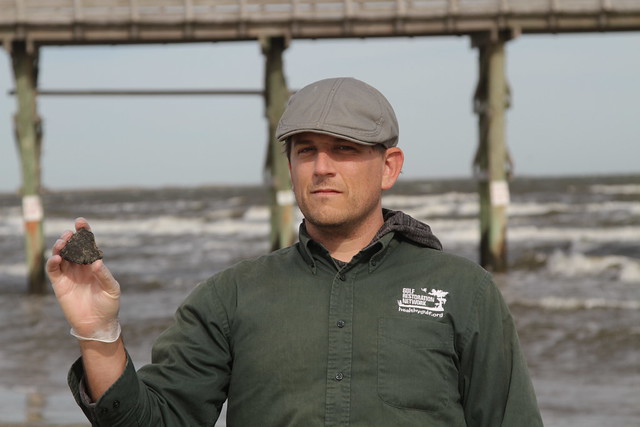
Tar on Grand Isle (black, hardened)
Tar on Grand Isle (grey, sandy)
Central Questions: Is the tar from crude or refined sources? How will Alabama tar balls compare to those from Louisiana? Can the oil testing discriminate between Macondo tar and tar from other spills?
Tuscaloosa Marine Shale, Louisiana
In the Florida Parishes of Louisiana, there is investment and movement to frack portions of the Tuscaloosa Marine Shale above the (sole-source) Southern Hills Aquifer. Community members concerned with the new movement to drill want to investigate drilling pits remaining from decades-old drilling efforts. If contamination is found, it would highlight the long term consequences of present or future drilling by revealing the extent of remnant contamination of closed drilling pits.
Old drilling pits about 90 minutes from New Orleans are used recreationally as ATV courses in Tangipahoa Parish. Although the pits were inspected by DNR and approved for closure, there are questions about DNR's process, and whether the ATC activity unearths any buried contaminants.
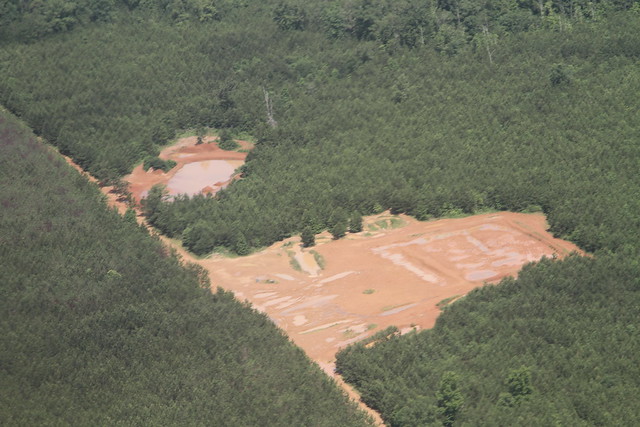
aerial view of drilling pits used for ATV recreation.
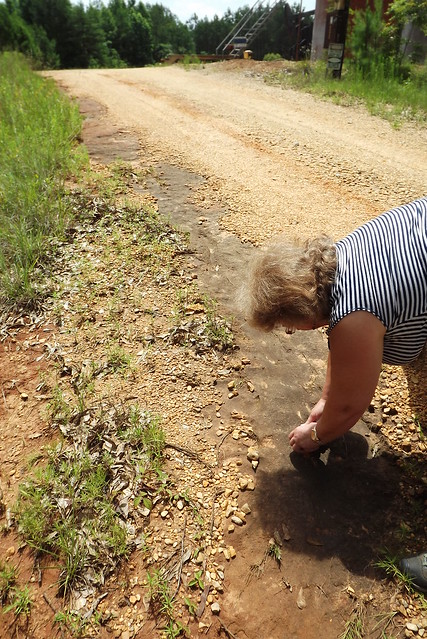
Community sampling of neglected oilfield site
Photo Album of community sampling of mud pits
Central Questions: Is there oil on these sites? Can the oil testing discriminate between consumer oil and remnant exploration wastes?
Follow related tags:
spectrometer oil-spill oil illustrated-guides

Oil Testing Beta --plus Grand Isle tar
What I want to do
This is my entry into the oil testing beta program--the sampling! I also want to include the Grand Isle coffee that Team Orca (RIP? undead?) collected in 2013. The GRN continues to hold Tarball samples taken from Louisiana and Mississippi Islands from 2010 to 2015. Matej has expressed an interest, so now I have to figure out how to mail such things.
The third iteration of the spectrometer really does resolve so many of the variables that made the initial spectroscopy of Grand Isle coffee so difficult for me. Kudos to the Spectral Workbench team for:
1) introducing the UV laser (after the original fluorescent lamp and green laser)
2) refining the 'box' from the conduit to the papercraft
2a) making the setup light tight
2b) greatly simplifying the alignment problem
3) improving the camera
4) settling on the square cuvettes
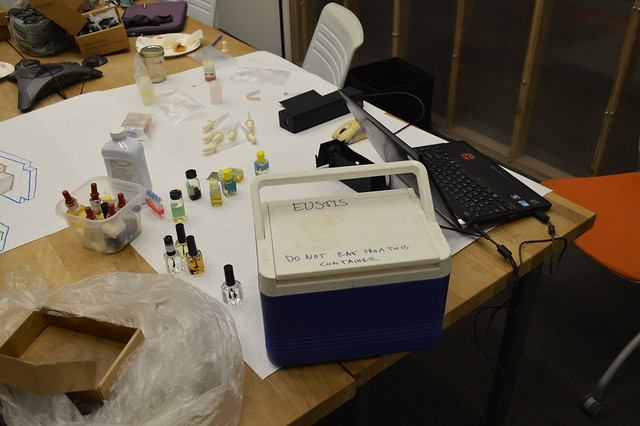
I was easily able to integrate my previous samples, kept in a cooler at room temp for a couple years, into the Beta testing system. Team Orca had an array of equipment for sampling and keeping tar balls in the field, which include:
1) small cooler with lasers
2) a number of pre-labeled glass jars (EPA brown glass or bell / mason jars)
3) nitrite gloves and ziploc bags for cleanliness
4) kitchen gloves for goop
5) a larger cooler or long term storage indoors
6) a larger cooler for transport of oil testing materials with previous samples (plus mineral oil, etc)
some of which is pictured here:
My attempt and results
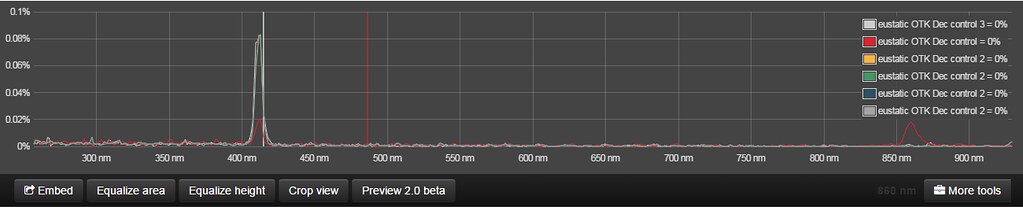
I was used one of Stevie's Favorite Spectrometers, version 3.0. this worked well, although there were occasionally some echoes in some of the fluoresence signals into the 860+ nm wavelengths.
We followed the instructions on the oil testing beta page, which the exclusion of smoothing the curves. I may try a second iteration of these data with curve smoothing.
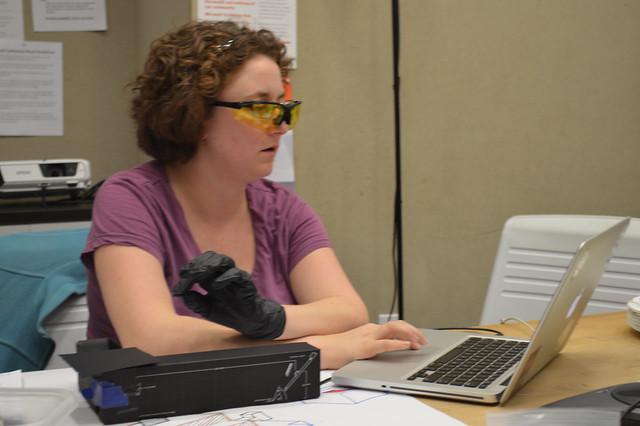
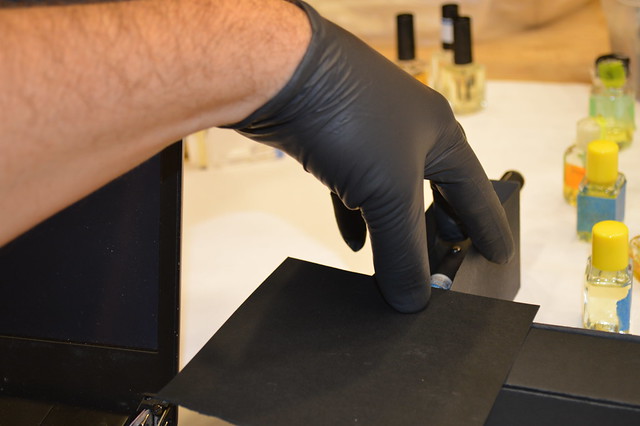
After mastering the one-glove-laser-and-cover technique (here demonstrated by DD), I was up and running in no time.
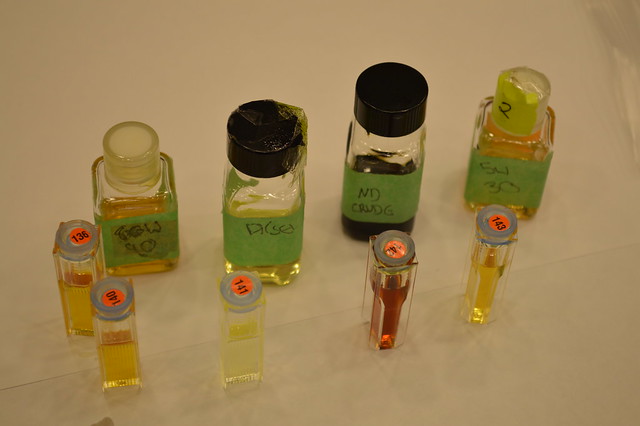
Mineral Oil Control (s2915)
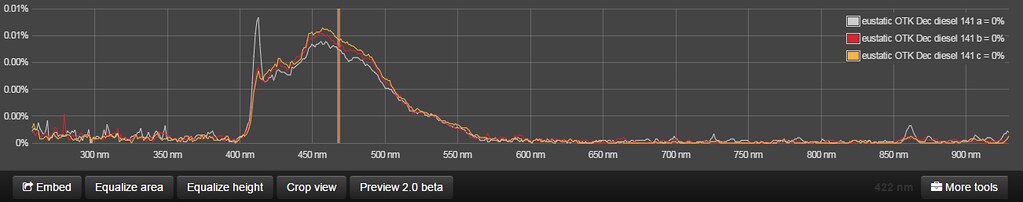
Diesel (v141) (s2924)
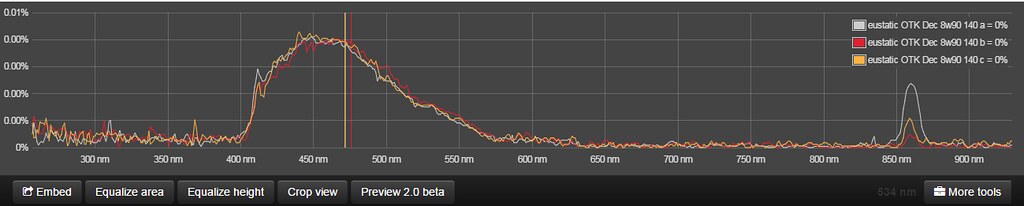
8w90 (v140) (s2919)
20w30 (v138) (s2921)

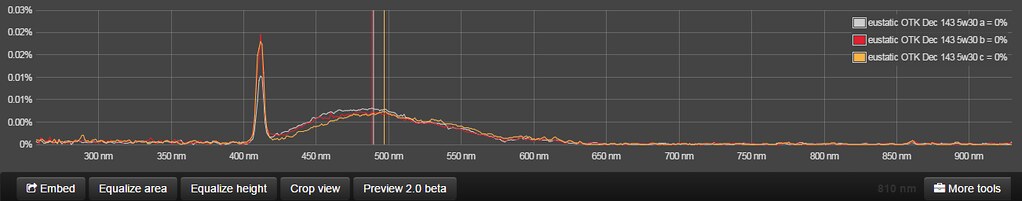
5w30 (v143) (s2926)
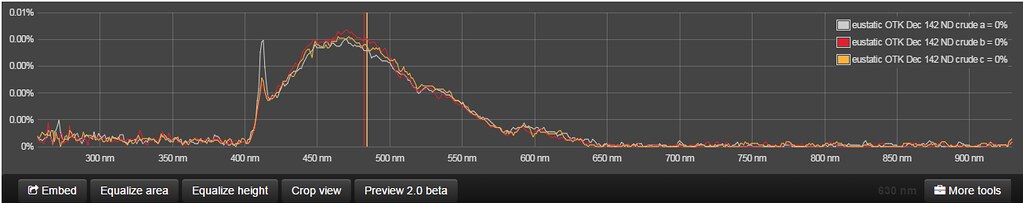
ND Crude (v142) (s2928)
Brake Fluid (s2944)

Grand Isle Coffee x10 dilution (s2937)
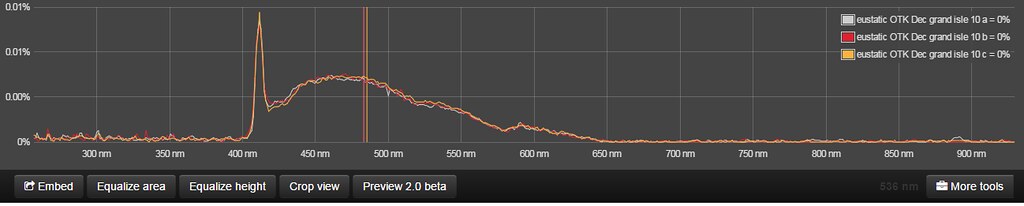
Grand Isle Coffee x100 dilution (s2939)

Unknown random sample from previous list (s2930)

I had thought that the unknown sample looked either like the ND Crude or the 5w30, but since the unknown sample didn't stink like the ND Crude, I assumed it was the 5w30. Stevie thought this was cheating; I call it ancillary information. I'm still trying to figure out how to compare the ND Crude to the Grand Isle Tar--although when i hit "find similar", spectral workbench found Ethan's ND Crude samples matched my Grand Isle samples (s2950). strange.
The intuitive smell test remains a critical component of Team Orca's repetoire As a field test, it's hard to beat. The nose knows--even one as terrible as mine, which has been numbed with a march of sinus infection problems that renders my smell and taste senses rather insensitive.
Questions and next steps
The cross-handed motion of running the laser while typing on the computer was a complicated motion. DD and DFlores both discussed the fact that oil spill testing was easier with two people--one to hit the laser, and one to type and click "save." It's also kind of gross; inevitably, oil goop gets on your keyboard.
The black cover over the vial / cuvette was helpful for reducing noise in the spectra, but also necessitated a complicated hand position.
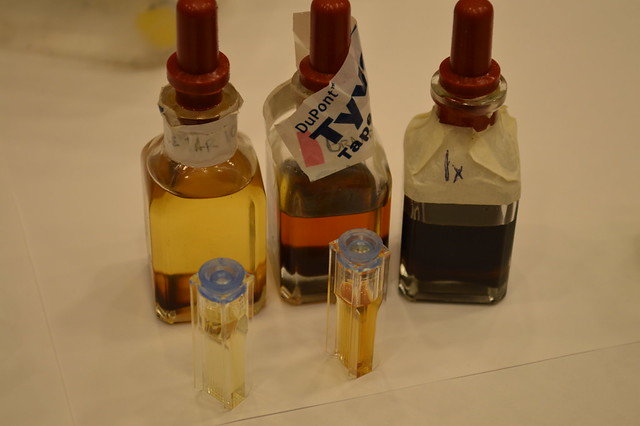
I have one example of a dilution--The Grand Isle Coffee is an informal 1x (half tar ball, ~half mineral oil) 10x (~ten times the mineral oil) and 100x (~ten times the 10x). the samples have different opacities.
Opacity readings?
Here you can visually compare the different opacities of different samples:
And here you can see the differences opacity of the different dilutions of Grand Isle Coffee. Not sure how to measure this with the spectrometer, although Ethan said we could.
Tar Balls over time?
Team Orca has over 30 jars of tar from 2010 to 2015. Do the spectra from what are presumably all Macondo tar balls appear different over time? Can we assume these are all Light Sweet Louisiana crude, or all from the same source?
Tar Sources? Can the Spectrometer tell different Crude oils apart?
Ed Overton at LSU studied tar balls in Louisiana and discovered 66 sources from less than 120 samples, based on Gas Chromatography / Mass Spectrometry. Could the spec distinguish "light and tight" Bakken crude Heavy Venezuelan tar or from "Light Sweet" Louisiana crude? Doing so would help distinguish tar balls from production spills vs transport spills.
Remediation?
What do I do with all these tar balls GRN has accumulated over 5 years? Would it be practical to develop a mycelial oil remediation kit to go along with the oil test kit, a la the Formaldehyde sensor kit?
Why I'm interested
Team Orca lives.. We will continue to experience tar balls washing up in Louisiana, Mississippi, and Louisiana. I will post my field kit and NRC procedures in later notes.
Follow related tags:
spectrometer oil pipeline orca

First "PIG Oil Only Absorbent Mat Pad" Test
What I want to do
Here is the first test of the PIG Oil Only Absorbent Mat Pad. I was testing the PIG trimmed to 7” 1/4” surface area using 1:40 ratio of water and 80W90 oil (6ml of 80W90 and 1 cup of water), attempting to recover as much pure product oil as possible.
My attempt and results
Unboxing... :-) this is how they actually ship them. Pic.1

The mats are about 1/8" thick, made of multiple soft layers. Most distinct are 3. Two on the surface and one in the middle. Between them is cotton like soft material. They feel waxy. The mat left a little bit of some sort of transparent oil/wax like residuum on my fingers. After a while it felt little skin irritating so I decided to use gloves. Overall they seem to be dry. Pic.2

I filled the container with 1 cup of tap water. Pic.3

I dripped 6ml of 80W90 oil across the container, attempting for balanced distribution. Pic.4

Placed the mat on the top. Pic.5

Oil absorbance was much slower than expected. No water intrusion observed. Pic.6 is showing how it looked like in first two minutes of the experiment. Pic.6

Here within first 5 min Pic.7

And here after 20 min. Pic.8

Seems like the oil started to soak in thru the the small holes and sides of the mat. Never made it directly thru the intact material. Pic.9

Bottom soaked the larger oil drops which did not dispersed in on the water surface, because the water was to saturated with the oil. Pic.10

At the end it was apparent that the PIG did not absorbed all the oil. in fact it left quite large residuum. After that I repeated the procedure with two more cloths. Both absorbed a little bit, although a sheen was still visible. Pic.11

Pic.12-a

Pic.12-b

From the initial cloth I was not able to recover large enough amount of oil. In fact I recovered only 1 drop of pure product. Because of that I had to use the mineral oil to dilute the sample and prepare it for the spectrometer. Good idea is to re-suspend the oil mixture which will secure even distribution of the pils in the mixture. Pic.13

Pic.14

I decided to cut out parts of the mat which soaked larger amount of oil in order to collect larger concentration. Pic.15

After that I soaked the cut outs in mineral oil. Pic.16

Very quickly the cut outs got saturated and transparent. Pic.17

I waited for about 5 min until the mineral oil mixed with the 80W90 and squeezed them into the 1oz flask. Pic.18

I was able to fill up more than half of the flask. After that I re-suspended the oil with a transfer pipette for couple of times and added 1ml of the mixture into a cuvette. Pic.19

After that I took triplicate spectra of the above mentioned mixture of 80W90 and mineral oil. Here is the spectra. First low concentration 1drop of 80W90 & 1ml of mineral
than higher concentration of 80W90 & mineral oil:
The PIG absorbed the oil well but it is harder to recover the oil from it. Most of the product gets lost and I had to use the mineral oil to prepare large enough spec for the spectrometer.
Questions and next steps
Next steps would be to find out how to recover more oil more efficiently form the PIG and find out if how much if the spectra gets changed.
Why I'm interested
I am interested to test figure out a way how to prepare best specs for the OTK and to test the ability of different different DIY techniques to separate oil from water. This is one of the methods I am trying.
Follow related tags:
spectrometer oil-spill oil water-quality
[Reference] Characterization of Chronic sources and Impacts of Tar along the Louisiana Coast
What I want to do
Link to a reference from Ed Overton, Paulene Roberts, and Charles Henry Jr, concerning the study of "mystery" tar balls suspected to come from the Mega Borg Spill of 1990. It's OCS Study MMS 93-0046.
Henry, C B, P O Roberts, and E B Overton. 1993. Characterization of Chronic sources and Impacts of Tar Along the Louisiana Coast. US Dept of the Interior, Minerals Management Service, Gulf of Mexico OCS Regional Office, New Orleans, LA. OCS Study MMS 93-0046, 64pp.
Currently, the grey lit is hosted on the BOEM site http://www.data.boem.gov/PI/PDFImages/ESPIS/3/3606.pdf
Why I'm interested
Tar balls are weathered crude oil from many sources, and have an array of impacts. Generally, they come in an array of shapes and appearances, but the aromatic hydrocarbons, such as benzene and napthalene, have dissolved or evaporated. Other, larger ring hydrocarbons are present--Hopanes are commonly referred to as characteristic hydrocarbons in weathered tar. The tar is not acutely harmful unless ingested; but unfortunately creatures like young sea turtles do ingest them.
There are still lots of tar balls washing up on Louisiana beaches, and it's a far question from which spill they came. Dr. Overton is still in the business of using chemical tests to 'match' tar balls to sources.
[note to GG: the Guardian uses the term 'fingerprint']
The paper classifies tar balls by pliability, color, morphology and by Gas Chromatography / Mass Spectrometry. It classifies tar balls into 9 categories (#9 is 'unclassifiable') and determines sources by a principal component analysis. There were 66 sources identified for less than 120 samples. Many 'sources' were found to match tar across wide geographic range of the study (which only included the Louisiana coast).
This is a reality check for trying to determine a method for identifying remnant Macondo tar vs serial tar balls in Louisiana in years to come. Certain oil types are described in the paper, but on the level of comparing Louisiana 'sweet' crude to say, Crude from the North Slope.
A second paper is
Studying and Verifying the Use of Chemical Biomarkers for Identifying and Quantitating Oil Residues in the Environment
Analytical chemistry and instrumentation provides environmental scientists with the ability to identify and track the fate of spilled oil residues in the marine environment Compounds commonly used for the identification of spilled oil to a source are called biomarkers. Biomarker compounds are universal in crude oils and petroleum products and are generally more resistant to environmental weathering than most other oil constituents. The distribution of biomarker compounds is unique for each oil and different sources of petroleum exhibit different oil fingerprints. Self-normalizing fingerprint indexes (SF1) calculated from the oil fingerprints provide a stable and useful tool for determining a match or nonmatch for different oil residues present in some environmental samples. A combination high-resolution gas chromatography and mass spectrometry, visual comparison and self-normalizing fingerprint indexes (SF1) were utilized to establish eight petroleum biomarkers for oil spill identification and assessment. The eight petroleum biomarkers chosen for detection and analysis were determined through a literature search and previous research. SF1 calculated from GC/MS analysis of tarballs and an oil degradation study validated the use of the eight biomarkers chosen.
Of the eight SF1, four remain stable over an extended period of time and laboratory simulated weathering. Visual comparison of biomarker fingerprints played an important role in distinguishing gross, and in some cases subtle, differences between unknown environmental samples. Double SF1 scatterplots were also utilized as a screening tool for source matchlnonmatch determinations.
Follow related tags:
gulf-coast orca oil-testing-kit otk

Oil Testing Beta
Mineral Oil Base

5W30

80W90

20W50

Diesel

NorthDakotaCrude

Overall the kit worked great. What would be nice is a way to cover the sample instead of the current way. Also what would be nice is a way to Edit the sets when complete. Other than that the test is great.
Follow related tags:
spectrometer fluorescence pipeline oil-testing-kit

Oil Testing Kit -- Beta tests (with some needed re-dos)
Purpose: Oil Testing Kit Beta Testing
These are sets of spectra scanned using my Public Lab spectrometer and the oil samples provided in the Oil Testing Kit. As a beta-test contributor, my aim is to contribute to the data that will allow us to evaluate the precision of the spectra obtained by a single tool and the reproducibility of spectra obtained by multiple tools.
Attempts and Results
Note that a lot of my spectra have very low intensities, such that I need to re-analyze those samples to get useful data. I am posting the results from all of the oil samples, but plan to re-do Auto Diesel, 5W30, and probably 20W50 too. The reason the spectra have such low intensities is that I did not notice that my attenuator was inserted, and it was as low as it would go, obscuring quite a bit of light. I will re-analyze them, being sure to remove the attenuator!
To compare the spectra, as the beta tester instructions detailed, I took triplicate scans of each type of oil and saved them as a set. I smoothed the curves, and then used the function "Find graph centers only between 410-700 nm." Jeff (@warren) and I have had a discussion about using this function, and also about reporting the lambda-max (the wavelength at which fluorescence intensity is greatest), which is likely to be impacted by the webcam's differing sensitivity over the range of wavelengths, especially at the edges of each band (R, G, B). Here, I report the graph centers and lambda maxima for each spectra within each set.
North Dakota Crude:

North Dakota Crude Graph Centers: * scan b: 534 nm * scan c: 531 nm * scan d: 530 nm
North Dakota Crude Lambda-Max: * scan b: 532-542 nm * scan c: 536 nm * scan d: 533-541 nm
80W90:

80W90 Graph Centers: * scan a: 479 nm * scan b: 481 nm * scan c: 489 nm
80W90 Lambda-Max: * scan a: 468 nm * scan b: 465-473 nm * scan c: 466-477 nm
For 80W90, reported precision is much better using lambda-max, even though there are ranges.
20W30:

20W50 Graph Centers: * scan a: 464 nm * scan b: 468 nm * scan c: 481 nm
20W50 Lambda-Max: * scan a: 436-439 nm * scan b: 462-468 nm * scan c: 464-468 nm
These shapes of these spectra are not very similar, and warrant a re-do.
5W30:

The recorded intensities are too low and the peaks are too broad to actually provide useful information. I am simply posting here to provide a complete (albeit flawed) set.
Auto Diesel:

Auto Diesel Graph Centers: * scan a: 460 nm * scan b: 462 nm * scan c: 464 nm
Auto Diesel Lambda-Max: * scan a: 436-441 nm * scan b: 431-450 nm * scan c: 436-444 nm
The intensities recorded here are, again, too low and too broad to be very useful and warrant a re-do.
Mineral Oil:

Mineral Oil excitation light wavelengths: * scan a: 391 nm * scan b: 393 nm * scan c: 393 nm
I thought this was interesting, as the excitation source was the same Blue Ray laser, and there is some variability in the recorded wavelength. I think the variability observed here is more likely due to the spectrometer than to the light source itself.
Two questions arise for me here regarding the excitation light: * (1) The Blue Ray laser is reportedly 405 nm, so is my calibration way off? * (2) All of my spectra except the ones for crude oil include this incident light in the 390-400 nm range. Did I fail to have my spectrometer snuggly engaged with the cuvette-holder attachment such that incident light entered my spectrometer in all of my analyses except for the ones I did with crude oil? Again, this warrants a re-do.
Next Steps:
- Analyze Auto Diesel, 5W30, and 20W50 with the attenuator removed.
- Try diluting samples in mineral oil and observing any effects of dilution on the shape or position of the fluorescence spectra.
- Try mixing oil samples and observing whether or not it is possible to discern the different oil components of the mixture from the mixture spectra.
Follow related tags:
oil-testing-kit oil-testing-kit-beta