Public Lab Lesson 3: Photography in a New Light
Infrared Curriculum Lessons 1, 2, 3, 4
curricular standards met by this lesson.
2.5 Hour Lesson
Grades 8-12 Co-written by Amanda Fisher and Mathew Lippincott
Description: In this lesson, students will explore the basics of infrared photography and how it can be used to monitor the health of plant life. This is intended to be the third lesson in the series of four.
Topics: photography, electromagnetic spectrum
OVERVIEW
| Segment | Format | Time |
|---|---|---|
| Introduction | Large group discussion | 5 min |
| Aerial Photos | Small group inquiry activity | 10 min |
| Understanding Cameras | Large group discussion | 5 min |
| “Seeing” IR | Small group inquiry activity | 15 min |
| White Balance | Small group exploration | 10 min |
| Removing IR filters | Small group exploration | 45 min |
| Photographs with filters | Small group exploration | 15 min |
| Photo analysis | Small group inquiry activity | 30 min |
| Plant Stress | Individual inquiry activity | 10 min |
| Wrap-Up | Large group discussion | 5 min |
LEARNING GOALS
Content Goals Students will understand:
how cameras and filters use properties of light waves to capture information.
the relationship between energy and light
technical assessments of ecosystem health
Skills Goals Students will be able to:
integrate quantitative data into verbal descriptions of color and plant health
utilize ratios to describe relationships between healthy and unhealthy plants
synthesize information from multiple media types, including videos, articles, and hands-on experiments.
SUPPLIES
| Supplies | Amt | Notes |
|---|---|---|
| computer with internet access | 1/group | |
| digital camera* | 1/group | Groups will be removing IR filters from this camera. Camera must have manual (or evaluative) white balance. |
| small screwdriver | 1/group | such as those used to repair glasses |
| camera with IR filter | 1 | A camera with an IR filter (most digital cameras have an IR filter) |
| camera without IR filter | 1 | Typically cheaper cameras such as web cams. On iphone 6 and earlier, the front-facing camera does not have an IR filter while the back-facing camera does |
| tweezers | 1/group | used to remove IR filter from camera |
| Exposed Film Negative | 1 piece/ group | To make this, expose a roll of film to light, then have it developed. |
| Red Filter | 1 piece/ group | Theatrical grade film. See Resource Section for where to buy. |
| Red, White, and Blue papers | 1 of each color/ group | Bright red and blue colors are best |
| IR-emitting device | 1 | Most remote controls emit IR |
| Pencils | 1/ group | to take notes while opening camera |
| Paper | 1 sheet/ group | to take notes while opening camera |
| Oil (optional) | a few Tbs | to distress bean plants |
| Cafeteria Trays (optional) | 1/ group | for holding parts while opening camera |
*Note: This lesson requires a digital camera for each group. Alternatively, if you are unable to locate enough digital cameras, you could use just one camera and remove the filter yourself. In this case, the “Photographs with Filters” activity and the “Photo Analysis” activity could then be done as class demonstrations.
ADVANCED PREP
Watch the instructional videos about IR and how to modify cameras. It may be useful for students to watch these videos in advance too.
http://publiclab.org/notes/mathew/02-13-2014/great-infragram-conversion-video-canon-elph-130is A step by step instructional video on removing the IR filter from a Canon digital camera.
http://publiclab.org/wiki/infragram A short video about using NIR photography to analyze plant health, along with a large amount of information and further resources on the topic.
Students may also read this National Geographic article on remote sensing, which includes information about visible and infrared light, satellites, and aerial photography: http://ngm-beta.nationalgeographic.com/archive/remote-sensing-new-eyes-to-see-the-world/. This tutorial about using NDVI to assess plant health is also useful: http://earthobservatory.nasa.gov/Features/MeasuringVegetation/measuring_vegetation_2.php. Ask students to take notes on the readings and bring questions to class. If the questions are not answered during the lesson, they can be used as discussion topics in the session wrap-up.
Test the camera with IR filter and camera without IR filter according to the directions in the “seeing” IR activity to ensure they will work. If an iphone is available, you can use the front and back facing cameras as your two types of cameras.
If possible, practice opening the digital cameras to remove the IR filter on one (or all) of the cameras before doing this activity with the class so that you are better able to provide accurate instructions.
INTRODUCTION
5 minutes
Begin class by going over classroom expectations, and reminding students of the information learned in Lesson 1 and 2. Review the important role of wetlands and how they’re being destroyed, as well as the types of energy in the electromagnetic spectrum and how our eyes see color.
Now that we’ve learned about the importance of wetlands, we’re going to see how we can monitor them using a special kind of photography called infrared photography. In our last lesson, we learned a lot about the visible spectrum of light. Today we will focus on energy just outside the visible range, near infrared, and how it can be used to capture information we can’t see.
AERIAL PHOTOGRAPHS
10 minutes
This activity can be done in groups of 2-5 students depending on numbers of computers available.
Materials per group: Computer with internet access
Direct students to www.maps.google.com and use the menu to change from street view to Earth view, which shows aerial images. Allow students to explore their town using this view, as well as areas around their town including both cities and more natural areas. Ask them to point out features such as streets, trees, lakes, rivers, houses, and parking lots.
Now have students point google maps to Louisiana. Allow students to explore the coast of Louisiana and ask them to zoom in and locate canals like those discussed in Lesson 1.
Where does the Louisiana coast end and the Gulf of Mexico begin?
Where are healthy wetland areas and where are distressed wetlands?
Questions like these can be difficult to answer. Aerial photography can give us a lot of information about large areas of our world, but it has limitations as well. Today we will see how aerial photographs that capture IR can help us formulate answers to these questions.
UNDERSTANDING CAMERAS
5 minutes
Most digital camera sensors (CCD and CMOS) see a wide range of light from the UV to the infrared, but in its raw form, the digital sensor just sees contrast and can't make out color.
In order to see color, a checkerboard of different filters, called a color array, is placed in front of the raw sensor. This red/green/blue pattern is called a Bayer filter, and is the most common color array.

https://en.wikipedia.org/wiki/Color_filter_array#mediaviewer/File:Bayer_pattern_on_sensor.svg
This divides up the information a cameras receives into three channels: red, blue, and green.

Even with a color filter in place, the camera still sees beyond the visible range. The blue channel picks up not just blue light, but infrared light, and the red channel sees into the infrared. To combat these issues, a glass or polyester filter that cuts out infrared is placed in front of the sensor, a device sometimes called a "hot mirror," because it reflects infrared. This blocks most energy from the IR range from being detected by the camera.

“SEEING” INFRARED
15 minutes
Depending on the number of cameras and IR devices you have, you may do this activity as a demonstration by walking around the room and allowing each group a chance to see it up close, or you may have the students do it on their own in groups.
Materials
- Camera with IR filter (most any digital camera, or camera on back side of iphone and many other smartphones)
- Camera without IR filter (such as inexpensive web cam or front camera of iphone and many other smartphones)
- IR-emitting Device (such as a remote control)
Where do we use Infrared, or IR? IR has a wide range of uses including night vision goggles, telescopes, and heaters. You may have heard that remote controls use IR. IR is a huge range of energy compared to visible light. Because it is so large, we divide it up into smaller sections including near-infrared (which is very close to the visible range of light), short-wavelength infrared, mid-wavelength infrared, long-wavelength infrared, and far-infrared. If you have seen an IR camera that shows body heat, or thermal imaging, this camera was measuring long-wavelength infrared. Today we will be focusing on near-infrared.

http://upload.wikimedia.org/wikipedia/commons/6/64/Infrared_spectrum.gif
Has anyone seen the IR that is emitted when you hit a button on your remote control? We can’t see IR, so if you have seen a button light up on your remote control, that’s because it is a separate light in the visible spectrum that is there mainly to let you know the remote is on and working. However, the actual signal the remote sends to your tv or radio is a coded IR message, similar to morse code. We can not see this message with our bare eyes, but today we will use a camera to see the IR message.
First, using the camera with the IR filter (back side of iphone or most digital cameras), view the pointer end of the remote control on the camera screen as you press a button on the remote. You may see one flash of light from the visible light bulb, or nothing at all. Next, repeat the same process using the camera with no IR filter (inexpensive web cam or front camera on iphone). You will see a separate light that may be a series of flashes- this is the encoded IR signal.
Although we can’t see IR with our eyes, it is all around us including in the energy from the sun, and cameras are able to pick up this energy with their sensors. Higher-quality cameras come with an IR filter that works kind of like the colored filters we used in the last lesson. It allows all visible light to enter the camera, while blocking out the IR. The IR filter prevents the camera from “seeing” IR, which results in a higher quality picture. However, sometimes being able to “see” and record that IR is useful, because it can show us hidden information about plants.
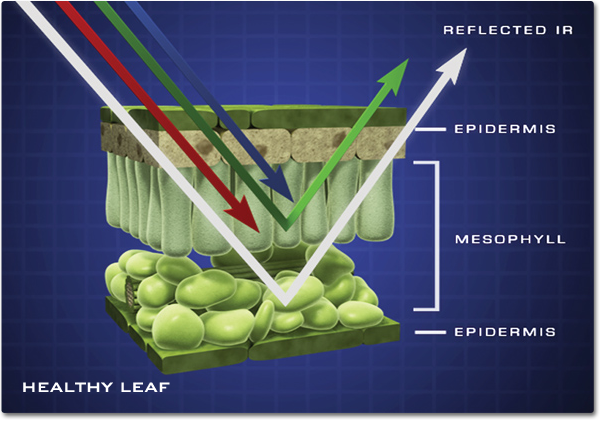
Remind students of Lesson 2 when you learned how different wavelengths of light reflect or absorb when they hit an object and cause the colors we see.
What colors of light is a green plant reflecting and absorbing? Plants absorb red and blue light and use them as energy to create food through photosynthesis. They reflect some green light, but they also reflect a lot of near-infrared (NIR). Healthy plants reflect much more NIR than unhealthy or stressed plants. If our aerial photographs can measure how much NIR is being reflected, they can tell if plants are healthy or stressed. In order to do that, however, we need to remove the IR filter that comes installed on most digital cameras.

http://missionscience.nasa.gov/ems/08_nearinfraredwaves.html

http://extension.usu.edu/nasa/htm/on-target/near-infrared-tutorial
In addition to studying plant health, measuring NIR can be useful in a variety of subjects, including nutrition and art restoration.
For further exploratory reading, see:
http://www.scientificamerican.com/article/organic-conventional-which-scanner-healthier
http://www.sciencedaily.com/releases/2012/06/120618111828.htm
WHITE BALANCE
10 minutes
For this activity, group size will depend on how many cameras you are able to provide. Ideally, there will be 3-5 students per group.
Materials per group
- Digital Camera
- Sheets of paper in solid white, red, and blue
As discussed in Lesson 2, our eyes do not detect even amounts of red, blue, and green, but our brains automatically adjust the levels of each. Cameras need to do this as well, because their sensors are more sensitive to blue light than to green or red. White balance allows us to adjust for this by changing the intensities of the colors in an image. It works in a similar way to the optical illusions we saw in Lesson 2.
The chart below shows how sensitive a camera’s three channels are to red, blue, and green light.

To reproduce colors the way the human eye expects them, we need to use the white balance function on the camera. Much like the human visual cortex, digital cameras now do some active color correction, but at their most basic, a technique called color balancing, or often "white balancing" is used. It is called white balancing because when an image is white balanced, the whites look white. A white sheet, or better, a grey sheet is usually used to achieve a white balance. Here is how white balancing an image will change the way a camera detects the three channels of light.

Try experimenting with white balancing function on your digital camera.
White balance the camera while pointing it at a white piece of paper. Take a picture of an object (a human face works well).
White balance the camera while pointing it at a bright blue piece of paper. Take a picture of the same object.
White balance the camera while pointing it at a bright red piece of paper. Take a picture of the same object.
Compare your three photographs. How did they change for each white-balancing color? Why?


Images taken with white-balance on white, blue, and red, respectively.
When using white-balance on something white, all three channels are even. However, when you use white-balance with a red sheet of paper, you are “tricking” the camera into thinking red is really white. The blue channel becomes over corrected and amplified, while red is subdued, making the photo that you take turn out more blue. The opposite happens when white-balancing with blue paper. Do you see any similarities between white-balancing a camera, and the optical illusions we did in Lesson 2 where we stared at red or blue paper until our cones were less sensitive to those colors?
Image of red sheet of paper, with and without balancing:


REMOVING IR FILTERS
45 minutes
For this activity, group size will depend on how many cameras you are able to provide. Ideally, there will be 3-5 students per group.
Materials per group
- Digital Camera
- small screwdriver
- tweezers
- cafeteria tray (optional)
- paper
- pencil
Using the tutorial information listed in the resource section, guide students through opening up the case of the digital camera, gently pulling back the LCD screen, unscrewing the sensor, and using the tweezers or a fingernail to remove the small square of IR filter in front of the lens. Then, reassemble the camera and test to make sure it works. While every camera may be slightly different, each camera should be similar enough to locate the IR filter. Encourage students to move slowly and carefully and remember how the camera will go back together afterwards.
A few hints:
- As students remove each part, have one student in the group record details of each step in order.
- Separate each screw according to where it was located. All screws may not be the same even though they look very similar.
- One method of recording where each screw is located is to make a drawing of the camera and put the screws on top of the drawing of where they were located.
- Remind students how easy it is to lose a screw! If possible, use cafeteria trays so that screws are less likely to roll off the table.
- Make sure students know they need to be gentle as they take apart the camera. If it won’t come apart, look carefully for screws, tabs, tape, or anything else that might be holding it in place.
- Small plastic or rubber pieces such as the buttons may come loose. Remember where they belong.
- When reassembling the camera, follow the recorded directions in reverse order.
Note: Some of the tutorials mention replacing the IR filter with a different type of filter. We will only be removing the IR filter, not replacing it.
PHOTOGRAPHS WITH FILTERS
15 minutes
For this activity, students should remain in the same groups.
Materials
- Camera with removed IR filter
- Exposed film
- Red filter
- Red paper
Now that the IR filter is removed from the camera, we are going to take a few photographs of the same subject using different techniques. You may choose as a group what subject you would like to photograph. It can be a person or any object around the room. Take three photographs of each subject:
- The first picture will be with the camera as is. This will capture both visible light and infrared light together.
- For the second picture, hold the exposed film negative over the lens of the camera as you take the picture. Exposed film negative will block all visible light while allowing NIR though. This will give a purely IR image.
- For the third picture, we will need to white balance the camera and “trick” it into thinking that the red light it is sensing is equal parts blue, red, and green. This will cause the camera to capture 2 separate channels of light- one visible and one NIR, instead of capturing both visible and NIR in the same channel. This will be important as we start to analyze the photographs. * * * Hold the red filter over the lens. Aim the camera at a piece of red paper, then use the cameras menu settings to select custom white balance (or WB). Now take the photo of your subject while holding the red filter over the lens. This will give a picture with separate visible light and IR information.
Have students upload these pictures to the computer and save them as image 1, 2, and 3. Ask students to compare the different images and make observations about how each image differs from the others.
Lets take a closer look at what we did for the third picture. For this photograph, we used a modified camera with a red filter instead of an infrared filter. Just like in Lesson 2 when we looked at object through a red filter, all visible light except red is blocked by the filter. Infrared light is not blocked.

Lets look at just two channels: red, and blue. The blue channel is now detecting only infrared. After we “white balance” on a red sheet of paper, we get a response more like this:

it would be nice if infrared got its own channel completely, but it doesn’t. Instead, the infrared is distributed between the red and “blue” channels, with the blue channel showing almost exclusively NIR, and the red channel showing a mix of NIR and red light.

PHOTO ANALYSIS
30 minutes
For this activity, students should remain in the same groups.
Materials
*Computer with internet access
For this activity, we are going to concentrate on photo 3- the photograph that has separate channels for NIR and for visible light. The reason this is important is because having two separate measurements of visible light and NIR allows us to calculate something called the NDVI. This stands for the Normalized Difference Vegetation Index and it allows us to measure how healthy a plant is. Healthy plants absorb most of the visible light that hits them, but reflect most of the NIR. Unhealthy plants reflect more visible light and less NIR. To tell healthy plants from unhealthy plants, we need to measure how much visible light and how much NIR are being reflected.
The formula used to calculate the NDVI is:
NDVI = (NIR — VIS)/(NIR + VIS)
For example, in the image of the healthy tree below, half of the NIR is reflected, while only 8% of visible is reflected. This gives a NDVI of .72. In the unhealthy tree, a little less NIR (40%) is being reflected while a lot more visible (30%) is being reflected. This gives a much lower NDVI of .14.
Check for student understanding by giving a few examples problems for them to calculate. Make sure students understand that higher NDVIs (close to 1) represent high density green healthy plants.
Explain how plants look more yellow when they are unhealthy because they are not using as much red light for photosynthesis and begin to reflect a greater portion of that light back. As the red and green light being reflected combine, it produces a yellow tint to the leaves.

Now that we understand how the NDVI is calculated, we’re going to use a computer program, along with photo 3, to calculate NDVI values.
Have students point their browsers to http://infragram.org/sandbox/ and click on the upload photo button here:

After uploading their photo, they will be asked what type of photo it is. Have them choose the “NDVI for red filters” Colorized option.

This program automatically calculates the NDVI for each pixel in the photograph. Each resulting NDVI number is then assigned a color. Higher numbers indicate healthier plants, and lower numbers indicate less healthy plants.
What objects in your photo have high NDVI values? Low NDVI values?
A NASA study used NDVI to assess trends in vegetative health in the Amazon: http://www.sciencedaily.com/releases/2014/12/141210171716.htm. In the article, the scientists relate the "greenness" of plants to carbon dioxide storage. With a partner, discuss the relationship between greenness and carbon dioxide, thinking about plant health and photosynthesis.
PLANT STRESS
10 minutes
For this activity, students will work individually with their own sprouted bean seeds.
Materials
- Bean seeds planted in week 1
- Oil to coat the plant (optional)
Now that are bean seeds from Lesson 1 have begun to grow, we will be preparing them for an experiment in Lesson 4. We will keep half of our beans healthy, but we will stress the other half.
Allow students to decide how they would like to stress their beans. They can remove the paper towel and not provide water, place the plant in the dark and not provide sun, or coat the leaves and/or roots with oil to simulate the effect of the Deepwater Horizon disaster.
We will leave our beans for the next week and see if we can use our new method of IR photography to determine the stressed plants from the healthy plants
WRAP UP
5 minutes
Let students guide the discussion about the day’s lesson and present their hypotheses before discussing explanations.
Why did we remove the IR filter from our camera?
What kind of information can be obtain from a camera without an IR filter?
Why did we need to use the red filter and white balance on red paper?
RESOURCES
Filter purchasing Rosco Fire #19
- http://store.publiclab.org/collections/intro-kits/products/infragram-diy-filter-pack This kit includes the red paper to be used for white balancing.
- http://www.barbizon.com/product_info/rosco-roscolux-fire.html This site allows you to buy a large filter for around $10 that could be cut into 30 4”x4” filters.
- http://www.rosco.com/filters/roscolux.cfm This site allows you to search for stores near you that carry theatrical filters.
http://publiclab.org/tag/conversion A collection of resources for removing IR filters from cameras
http://publiclab.org/notes/mathew/02-13-2014/great-infragram-conversion-video-canon-elph-130is A step by step instructional video on removing the IR filter from a Canon digital camera.
http://publiclab.org/wiki/infragram A short video about using NIR photography to analyze plant health, along with a large amount of information and further resources on the topic.
http://publiclab.org/notes/warren/08-15-2013/white-balancing-a-canon-camera-for-infragram-photography information about white balancing for NIR photography. Note: In this lesson we use a red filter and white balance with red paper. It is also possible to use a blue filter and white balance with blue paper as mentioned in the link above.
http://ngm-beta.nationalgeographic.com/archive/remote-sensing-new-eyes-to-see-the-world/
http://www.sciencedaily.com/releases/2014/12/141210171716.htm
http://earthobservatory.nasa.gov/Features/MeasuringVegetation/measuring_vegetation_2.php
VOCABULARY
Electromagnetic Spectrum: The range of wavelengths of electromagnetic radiation extending from gamma rays to the longest radio waves and including visible light.
Infrared: Electromagnetic radiation having a wavelength just greater than the red end of the visible light spectrum but less than microwaves. Infrared radiation has a wavelength from about 800 nm to 1 mm, and is emitted particularly by heated objects.
Near-infrared (NIR): The part of the infrared spectrum that is closest to visible light.
NDVI: The Normalized Difference Vegetation Index (NDVI) is an indicator that can be used to assess vegetation density and condition