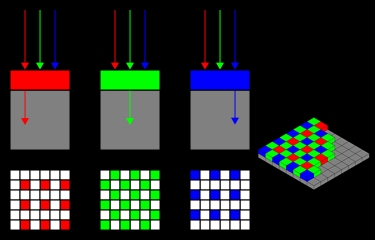
I have been reading a lot about spectroscopy and spectral analysis lately. I got a lot of feedback from the community here and someone pointed me to how a Bayer webcam filter worked. The Bayer filter essentially is divided into 4 squares (or channels) per pixel - Red,Green, Green, Blue. For each pixel we get the four intensities (photon counts) from the webcam which will be reduced to three channels (RGGB -> RGB) by putting the two Gs together into 1 channel.
The Spectral Workbench shows us these three channels plus another curve for "average". And that's where I got stuck.
Why average?
If we want to know how many photons hit a webcam pixel at a certain wavelength - shouldn't we sum up the four (RGGB) or three (RGB) channels? We would get a much higher intensity curve that shows all photons. Averaging reduces the overall amount of photons per pixel.
Even the reduction of the two Greens into one channel by some "Bayering" arithmetics throws a lot of photons into the trash can. I've read that some people use CCD sensors with scratched-off filters to achieve better results but I guess it would need a change in the green channel averaging software, too, to receive more correct results counting all the photons available.
If I am wrong with my thoughts here it would be great if someone could explain to me where I was wrong.
In Spectral Workbench the Y-axis on the spectrogram is "Intensity (%)." If you took the sum of all three channels and plotted them on the same graph, wouldn't it look exactly the same as the average which is plotted now? There is no more information in the sum than in the average. Unless you are capturing and using camera RAW images, the data in the photo files have been through a lot of processing and are a long way from counts of photons. It's just some massaged representation of brightness.
Chris
Is this a question? Click here to post it to the Questions page.
Reply to this comment...
Log in to comment
hey viechdokter, the "scratched off" ccd screen, is the color film on the sensor's surface, very tricky and very risky to attempt it, but what happens is yes, there will be a little more resolution but it will be in monochrome (black and white.) usually people will do that when they are taking long time exposure photos of the cosmos!
I have a NexImage5 ccd sensor camera which I use for this purpose but I would never remove the color layer just to get a few more pixels of resolution.
Reply to this comment...
Log in to comment
Ah, okay, I forgot about the "%" sign. I knew I was missing something. Just didn't know what exactly. Thanx for the quick answers.
Reply to this comment...
Log in to comment
Right, the (R+G+B)/3 average contains all the camera can deliver. [Aside: There are, however, separate 'weighted' formulas for combining RGB to get grey-scale images from color images -- none are exact, but grey-scale isn't the same a data from non-filtered sensors.] There is the complication that the Bayer filter's transmission curves are only approximations of what the eye detects and the camera's internal conversion of it's detector sensitivity, plus Bayer curves are then processed to give a "pleasing" representation to the eye -- i.e. roughly matching the eye's sensitivity. On top of all of that, the images are jpeg encoded (DFT filtered in the frequency domain) for compression to lower the output data bandwidth. So, yes, there is a lot of information lost in the process. However, webcam noise and the 8-bit depth limit are probably an order of magnitude more degrading than effects of the Bayer + JPEG. For good digital cameras, 'raw' image data is sometimes available. Again, however, that raw data has been 'converted' from the sensor's 'raw pixel' data which is still Bayer filtered so, even with expensive digital, the data doesn't come direct from the sensor's 'raw' intensity values.
Reply to this comment...
Log in to comment
Thanx for explaining all this. Uhm, these "raw pixel data" you talked about, is THIS an electron/photon count? And if so, how long does the normal webcam count? I guess in DSLRs it counts as long as the shutter is open?
Is this a question? Click here to post it to the Questions page.
Reply to this comment...
Log in to comment
Sure. No, it's not a photon count, but it is related -- though the DSLR is attempting to extract data that represents a film negative. To do that, the camera has an internal 'raw-converter' which processes pixel data (photon count) with nearby pixel count, non-linear gain and noise reduction, etc. to get the "best" raw image in a 12-14bit format (jpeg is 8-bit). So the 'count' accumulates for the length of the exposure but is then processed before the 'raw file' data is output. Since there are many sources of image noise, the DSLR's are very helpful in improving the raw output generated from the raw photon count. With a photo-diode array detector for a spectrometer, considerable processing is also required to extract the best signal data -- but that processing is done after the sensor data is collected.
Reply to this comment...
Log in to comment
We'd have a lot more to work with if we knew which pixels were originally red vs green vs blue, and we could probably make more intelligent decisions about how to use each color channel. That said, I think @stoft is right and we could do some more with weighted formulas... pretty easy to do with the
transformoperation: https://publiclab.org/wiki/spectral-workbench-operations#transform (which works similarly to Infragrammar, actually)Reply to this comment...
Log in to comment
Hmmm ... remember that the jpeg data is derived from MANY pixels which were run thoguht demosaicing from the RGGB filtered data, so unless you had 'raw' and the Bayer layout, there's no way of extracting anything which relates to the RGGB pattern. RGB greyscale weighting only helps with making nicer visual grey images and is of no help (improvement) in extracting the spectra's gain profile. The best I think you can do with the webcam is with the various techniques I've extracted in my series of 'noise and stability' notes.
Reply to this comment...
Log in to comment
I think if you capture camera raw you have a single number (DN) for each pixel and you know what kind of Bayer filter that pixel was under. The DN must be 12 or 14 bits?
If you knew the spectral sensitivity of the sensor, you could correct the raw data for intensity at each wavelength (e.g., in a photo of a diffraction pattern).
You would sacrifice the camera's sophisticated corrections for noise and lens distortion, including chromatic aberration, vignetting, etc, but you would probably be way ahead of what you get from a jpeg.
Is this a question? Click here to post it to the Questions page.
Reply to this comment...
Log in to comment
But that was part of my point -- the camera does 'raw-capture' processing on the sensor's 12-14bit detector data before it gives you the 'raw' data file -- so even though you could discover the RGGB pattern correlation and find the 'typical' sensor sensitivity curves, you can never really know the pixel sensor bin data. But agreed, that is a technical detail -- nobody actually wants the true hardware data as you'd have to perform all that additional processing outside and without the knowledge of the maker of the camera and chips. So, right, DSLR "raw" data really is better even with the camera's internal pre-processing; though gain correction would still be required as the 'raw' data is not linear or flat over wavelength; but the 12-14bits help.
Reply to this comment...
Log in to comment