Background: This is an experiential application of using spectro as a measurement of the concentration of the urine. So people are unaware that they drink insufficient water. This experiment helps us to generate information and provide evidence whether they have drink sufficient H2O and provide advice to them.
Method The method has been published in this research note under the incandescent light. http://publiclab.org/notes/chongyukwai/05-23-2015/heat-con-spectro-photometer After taking the spectro image of all three in 0 degree, the image is analysed using spectrobench and auto detect the highest peak Result and discussion: Data was published in this page. https://spectralworkbench.org/sets/show/2219 It showed that in the H2O, all the light can pass through. However, even when there was slightly color difference in the urine. The spectro still can detect and give a unbalanced index compare to different wave length.

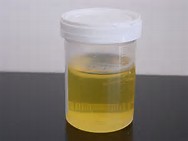
Left is light urine and the right is normal tape water

Compare with light urine and H2O, all light can be transmitted in H2O but in light urine red and purple light were being absorbed which can be deviated between the two. In high concentrated urine, a significant high peak value was found in the yellow spectrum. Discussion: Further research is needed in order to more quantitative identify the concentration of urine and whether it has reached certain level (pathogenic level).
4 Comments
Your three spectra don't seem to have the same range -- are you sure about their calibrations matching?
Is this a question? Click here to post it to the Questions page.
Reply to this comment...
Log in to comment
Yes, i have done the calibration manually uses the blue and green light. Because the urine(concentrated urine and non-concentrated urine) are collected in different period of time. Therefore, the composition is slight different(creatinine/urea/albumin),etc. Because in real life, you cannot expect that they have the same composition when the urine are collected in different period of time. I have done some procedure that to decrease the variation eg using a mid stream urine to prevent the type of normal flora in different urine! Further analysis can be done in that part(paper chromatography),etc. And the water and urine, they have different material. Therefore, it will affect the range. Range that are not less than 400nm and large than 700nm still have not been validated according to the API and may be just an artifact even though I have calibrate it!I used strong light as I placed the spectro near the incandescent light bulb as the procedure said .Therefore, that data is not valid as it can be the artifact value! Actually if it is less than 25% of the transmission as it said in the manual. It is considered as dim lights. And I used that 25% as a cut off point as whether they are significant or not. Below is not significant and above is significant!
Reply to this comment...
Log in to comment
I'm worried though that your images are not taken with the same calibration, so the wavelengths may not be comparable. Also, in this sample, I see two overlapping spectra, so the colors may be mixing: https://spectralworkbench.org/spectrums/49972
And in this one (https://spectralworkbench.org/spectrums/50007) the spectrum is at a very different angle, so I worry that you have not taken it under the exact same setup. See how in this example, most of the spectra start and end at the same wavelength?
https://spectralworkbench.org/sets/show/2232
But the blue spectrum (#5) is much wider (starts earlier and ends later), so in that case we aren't as sure that it has a matching calibration. It surely was not taken with the same setup!
Is this a question? Click here to post it to the Questions page.
Reply to this comment...
Log in to comment
I think that set still has error since some of the important band is still below the dim light area eg red if they are using the same light source and we can only minimize error as much as we could. Actually, I just cut off the important spectrum in the spectro to do analysis and discard the unwanted spectro bit due to the artifact of the lens of the camera. It does not mean that it recorded in a different angle. Currenly, it can only operate at 0 degree angel.But in the water part, the unwanted band cannot be cut off anymore. Besides,the pattern match the literature(pattern such as slightly blue/all have the same transmission are acceptable IN RESEARCH PURPOSE). It is still not diagnostic stage. Therefore, the data is validated. Therefore,it does not require to be the same run. And I don't know whether is due to the equipment only allows single run or due to other issue. By the way, i will redo the data set and will further test with different H2O XN time to determine the precision after a couple week(may be a couple of weeks since QC is very time consuming) later since my PCR tube has been broken ! Thx for your recommendation anyway.
Reply to this comment...
Log in to comment
Login to comment.