Jeff is making great improvements to the way you can calibrate spectra at Spectral Workbench. His nice graphical interface uses the image of a well calibrated spectrum of a compact fluorescent lamp, and for that reference image he is using a spectrum which I made in 2013. Back then I noticed that this and other CFL spectra I was making did not match well with the known emission lines of CFL lamps. So I corrected this spectrum mathematically to make it match better. The correction “rubber sheeted” my spectrum data to shift some lines more than others until they fit well with the known reference.
The new match was not perfect, and I was especially puzzled by two emission lines. These are the bright green lines in the center of the spectrum that are about 4 nm apart. The Wikipedia reference I was using suggested that these lines should differ in wavelength by only 2 or 3 nm. The mathematical correction could easily move lines that much, but it could not independently shift two lines which were that close together. So after the correction those two lines were still farther apart than Wikipedia said they should be.
The types of things that could cause my spectrum to deviate probably distort large areas of the image field. I suspect that the thin plastic film diffraction grating in my spectrometer is not very flat, and the wavy surface could cause the errors. But that type of error is not likely to cause two emission lines to shift from being 3 nm apart to being 4 nm apart when other parts of the spectrum have not shifted very much. And it was not just a single CFL spectrum with this anomaly, all of my CFL spectra showed those two lines to be about 4 nm apart.

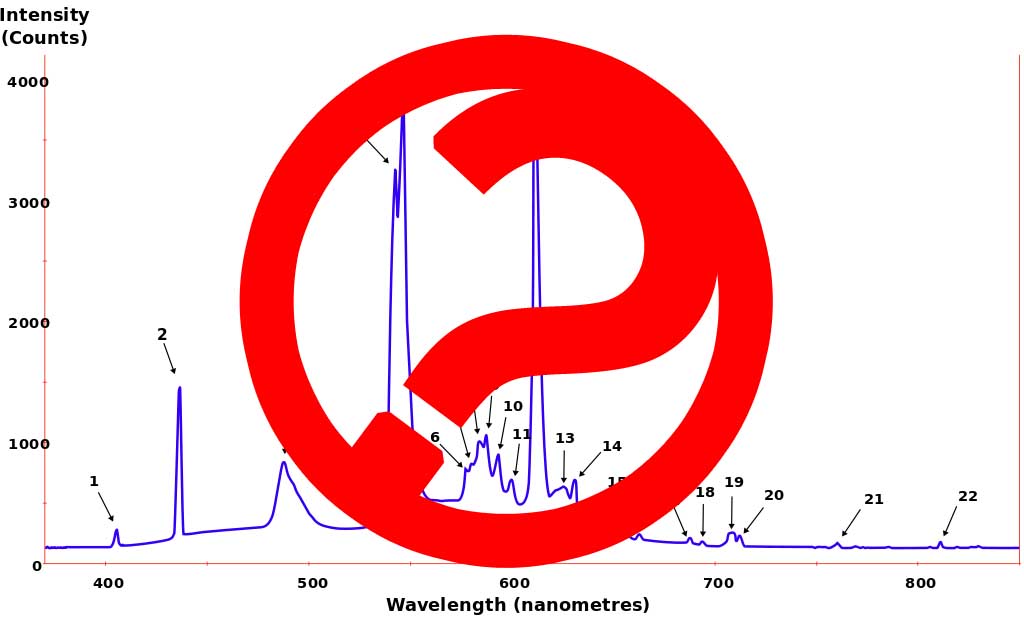
Photos of the diffraction pattern of a CFL bulb always show the two bright green lines to be separated by about 4 nm. But the Wikipedia source identified the two lines as being only 2 or 3 nm apart. Dashed lines are at the wavelengths of emission lines identified in the Wikipedia image, the magenta trace is the intensity graph of the background image of a diffraction pattern from a CFL lamp.
So I took a closer look at the Wikipedia source. Those two lines are identified as being emitted from terbium (~543 to 544 nm) and mercury (546.074 nm) so they should be separated by 2.074 to 3.074 nm. That terbium line seems to be rather imprecisely described, so I checked the two sources cited at the Wikipedia page. To my surprise, the NIST database does not include any terbium lines from 543 to 544 nm. An article on phosphors cited as the other reference includes a graph of terbium emissions with a peak somewhere around 540 nm, but does not identify the peak more precisely. So those references don’t seem to offer any support for a terbium emission line between 543 and 544 nm.
The NIST database includes a very bright mercury line a 542.525 nm. The relative intensity given for that line is 8,000,000. There is no terbium line in the NIST database between 530 and 550 nm with a relative intensity greater than 160. Without any other evidence, I am assuming that the “terbium” line is probably a mercury line at 542.525 nm. That would make it 3.55 nm away from the other mercury line at 546.074nm and much easier to reconcile with the results from my spectrometer.
This raises doubts about the accuracy of other information in that Wikipedia source. Most of the major lines are probably identified correctly, but I don’t know how to confirm this. A couple of the orange lines identified as being emitted by europium between 586 and 600 nm don’t match well with my spectrometer’s results. I haven’t looked into possible alternative assignments for those lines. It is possible that the compact fluorescent lamp I used had different phosphors than the one used to make the Wikipedia spectrum. It will be important to remain wary of this mismatched lamp possibility when using the new tool at Spectral Workbench to calibrate a spectrum made from the CFL you happen to have on hand.

Upper spectrum is the photo straight from the camera of the diffraction pattern of a CFL bulb. Lower spectrum is the same photo modified in Photoshop to match the known emission lines in a CFL lamp (white dashed lines). The magenta trace is the intensity graph from Spectral Workbench of the corrected image.
For further calibration work at Spectral Workbench, Jeff needs both a well calibrated data set of CFL spectrum intensity at each wavelength and an image of the CFL spectrum. I have redone the mathematical correction using a different wavelength for that terbium/mercury line, so the data part is easy. It is harder to apply a mathematical correction to a color image. So I have used Photoshop to manually move emission lines or groups of lines right or left to match with my newly corrected data set. This seems like an unscientific approach, but it is not necessarily any more arbitrary than sliding the lines around mathematically with a third order polynomial. The unscientific part is that the mathematical correction is precisely described and repeatable, while my manual manipulation is not.

The intensity graph from Spectral Workbench of the manually corrected image of the diffraction pattern of a CFL lamp. Vertical dashed lines are the known emission lines according to the Wikipedia source, except for the line at 542.525 nm.
After I created the corrected spectral image, I submitted it to Spectral Workbench, assigned wavelengths to it with a macro, and downloaded the data file of intensity at each wavelength. Now there is a corrected image and data set that match perfectly. These don’t have a solid pedigree of traceability to repeatable physical measurements, so they are more like models of what an ideal CFL spectrum would look like. The primary weakness with using them for Spectral Workbench’s calibration procedures is their strong dependence on the information in a single Wikipedia image. Until more of the emission lines can be confirmed, we might have to assume that they are close enough.
The corrected image of the diffraction pattern and the intensity data from that image are available at Spectral Workbench: https://spectralworkbench.org/spectrums/58696.
22 Comments
Don't we have an ocean optics spectrum to source from too? I don't remember if we took a cfl spectrum with it, but we could maybe ask Mary to take one... Or one of the folks in the Oil test kit beta program, as a couple have access to lab specs.
Is this a question? Click here to post it to the Questions page.
Reply to this comment...
Log in to comment
Chris,
Have you ever looked at "The Elements Spectra"; it gives you numerical values of the peaks, you can get it from: www.infini-t.com or email : custserv@infini-t.com; or just enter The Elements Spectra into Google. I have glanced at Terbium and there seems to be a lot of peaks noted.
Gwill
Reply to this comment...
Log in to comment
Thanks, Gwill -- good resource.
Chris, I wanted to get some more clarity from @gretchengehrke on the mercury oxidation states in the comments of my post. Hopefully that'll answer some questions, but it seems like your suspected 8,000,000-intensity line is listed as Hg II. I also wonder if there could be a blend of different oxidation states... I really don't know the chemistry.
Reply to this comment...
Log in to comment
Hi Gwill, there do seem to be a lot of terbium peaks. I have not yet figured out how to know which of those peaks are expected in the light from a CFL. Same with Hg peaks which are also numerous. Here is a figure which labels a terbium peak at 542 nm:
Jeff, A fluorescent bulb works because the electric current turns the gas in the bulb into a plasma which is by definition a bunch of highly ionized atoms. So I guess we should expect lots of different ions of all the components of the gas (typically argon and mercury). So lots of Hg emission lines are possible, but only a few are prominent in CFL spectra. The fact that it is difficult for us to figure out which of those dozens of peaks to expect suggests that something sort of complex is happening. It does not help that both Hg and Tb have emission peaks at very close to 436 nm and 542 nm. In fact that is sort of unfair (but maybe the basis for a good exam question in freshman chemistry).
I don't know of a Hg spectra from Mary and John's spectrometer. I missed the whole spectro session at the last LEAFFEST. Too bad because there are lots of things it would have been good to get spectra of. You would think that good spectra of CFLs would be common.
Reply to this comment...
Log in to comment
If it's helpful, we can probably ask some of the OTK beta participants for one, since a couple have access to lab spectrometers.
In your image/image comparison, I'm curious -- since we calibrate based on the 436nm blue line, what does that comparison look like if 546 and 436 are aligned, instead of the 405nm blue line? I'm interested in if the distortion in our spectra is accentuated towards the wavelength extremes, and if our match is better for the central lines.
This is tough. I think perhaps the best we can do is to try to get a dataset from a calibrated lab spectrometer and treat that as our reference, even if we don't know the identities of all the lines. Does that make sense?
Is this a question? Click here to post it to the Questions page.
Reply to this comment...
Log in to comment
That's a very important observation. Had I originally calibrated this spectrum on the 436 line and the 611 line (instead of 405 and 650), all the other lines would have matched much better. I think it might be a mistake to use the outer lines for calibration because they might have more distortion for some reason (maybe the effect stoft was describing). Nevertheless, the polynomial was able to correct the lines well, so the final spectrum is probably better than any uncorrected one.
Reply to this comment...
Log in to comment
Would you be willing to try a recalibration using the 436/546 lines as a starting point? Would that be useful as a point of comparison?
Also - I believe I've gotten a root mean square error system running but its results seem inconsistent to me. I can show you at LEAFFEST, but maybe some tweaking will help -- it's possible I've made a mistake. It's not notably better than the old "fitness" system.
Is this a question? Click here to post it to the Questions page.
Reply to this comment...
Log in to comment
If the original Snowy Sky CFL is calibrated by pinning down the 436 nm and 546 nm peaks (using a macro) it looks like this:
Most of the peaks do not match with their known wavelengths. If the 436 nmm and 611 nm peaks are used it looks like this:
Those two pinned peaks are farther apart and should allow for better calibration. I think on average the match with known peaks is closer, but only a couple of peaks other than the pinned ones match within a nm. So a non-linear correction like the third order polynomial seems to be required to make the major peaks of this spectrum line up with reality:
Reply to this comment...
Log in to comment
Hmm. I guess there are pros and cons to each approach.
I agree that the 546 line doesn't result in a great linear calibration -- some end up about 5 nm off. For example, the OTK test calibration I used in July has the red line appearing at 613.14nm instead of 611.60nm. That's ~1.5nm off.
But it's hard to say -- i cloned and recalibrated it with the new interface, and got 436.32nm, 542.7nm, and 609.65nm -- manually placing the lines using the image reference as a guide. That's approximately 0.5nm, 3.3nm, and 2nm off, respectively. That's not too bad, although it may get worse towards the extremes.
The cons of tackling polynomial calibration right now are that:
I think that if we quantify the error using root-mean-square-error assessment, we should stick to 436/546 linear calibration for the time being. Now that it's possible to do calibrations completely in JavaScript, I should finish the API and documentation so that it's easier for anyone (even if it is just me, later) to add a new calibration module on top of the existing infrastructure.
What's more, the RMSE assessment plus the visual image-comparison reference in the new interface allow people to make different decisions -- not just using 436/546, but balancing the errors out along the span of the whole dataset visually. How's that sound for now?
Is this a question? Click here to post it to the Questions page.
Reply to this comment...
Log in to comment
Oops, meant to share links to my tests -- here's the one I used the new calibration system on, and listed 3 approximate errors for: https://spectralworkbench.org/spectrums/show2/58942
Reply to this comment...
Log in to comment
Hmm. So I'm wondering if part of the fit problem is because we're simply comparing intensity at the 14 points and 13 troughs. Take this example:
Though I equalize the max heights of the two before running RMSE, I bet the baseline variation makes the match not great. I could try not measuring troughs? But that doesn't seem right.
Or, we could "search around" each of the 14 expected peaks for where peaks actually occur, find their exact real locations, and add up the error for each peak. This could fail if not every peak is found, but we could narrow it to fewer, more prominent peaks.
I may simply have made some dumb mistakes in implementing RMSE, but if the approach has more fundamental flaws, maybe this is an alternative.
Is this a question? Click here to post it to the Questions page.
Reply to this comment...
Log in to comment
@warren , @cfastie I see i'm kinda late to the party, i can offer source verification (you can ship CFL source to me) with 3rd party device, Ocean optics and LR1 from aseq http://www.aseq-instruments.com/LR1.html i have access to few devices... Sorry for not joining barnraising this year 8-/
Reply to this comment...
Log in to comment
Oh thanks! I believe, but Chris may correct me, that it'd be sufficient to measure a cold long tube fluorescent lamp and compare it to pretty much any warm CFL. That'd be interesting to see!
Reply to this comment...
Log in to comment
Hi Robert,
In this note and comments we were lamenting the lack of replicate spectra of CFL lamps to confirm the information at the Wikipedia page. It's still startling that there aren't plenty of reliable spectra of CFLs online, but I have not found any to compare to the Wikipedia spectrum. So it would be really helpful to have a spectrum and data file for a CFL from a well calibrated spectrometer (or two). If the near infrared can be included that would be helpful, so maybe 300 to 1000 nm. It would also be good to have spectra for different types of fluorescent lamps to see if there is a consistent difference among lamp types.
Thanks,
Chris
Reply to this comment...
Log in to comment
I will start with long CFL tubes that i just did... Unfortunately i don't have bare tube (diffuser in front/office lights) that might play same role in peak smear. this is full spectra
Zoom with readout on peak@544.6nm
Zoom with readout on peak@545.9
Reply to this comment...
Log in to comment
Oh, great -- do you have raw data for these as well, like CSVs?
Is this a question? Click here to post it to the Questions page.
Reply to this comment...
Log in to comment
Yes i do, here:
FC__long.txt
Reply to this comment...
Log in to comment
Oh and i suggest using QTI plot (you can zoom into graph data way better then excel, plot traces with just right click/plot) very nice open source tool. https://intranet.cells.es/Members/cpascual/docs/unofficial-qtiplot-packages-for-windows
Reply to this comment...
Log in to comment
Thanks @zega!
Reply to this comment...
Log in to comment
By comparing my spectra of the Sun (more lines for precise polinomial callibration) with that of the CFL lamp, I can confirm that the green line is almost certainly sodium 546.074. The other peak is at 541.68 and is probably Tb. Here is my spectrum:
And here is the data, if anyone is interested. cfl.txt (space separated) raw intensity: 1,3 calibrated intensity: 1,3/4*5
Reply to this comment...
Log in to comment
I didn't know sodium was used as a phosphor in CFL lamps. That green line is one of the brightest in CFL spectra and in all mercury spectra, and mercury is always present in CFLs.
Reply to this comment...
Log in to comment
Ups, I meant mercury, not sodium, of course. The line I can't identify is the one at 445.1 and 445.9nm. Any ideas? Also, are the two faint lines on each side of the mercuty/terbium green line it's 'satelites' or something else?
Is this a question? Click here to post it to the Questions page.
Reply to this comment...
Log in to comment
Login to comment.