
Image above: Spectrum of a CFL calibrated by anchoring two well-known peaks at 405 and 650 nm (arrows). Other peaks do not align well with their known wavelengths.
Calibrating a Public Lab spectrometer is a crucial step. The raw image from the spectrometer's camera has no information about which wavelengths are represented until it is associated with a wavelength scale. Typically, this is done in Spectral Workbench by identifying two well-known peaks in a spectral image of a compact fluorescent lamp (CFL). Spectral Workbench then knows how to stretch a wavelength scale along the image. If the image is a faithful representation of a good diffraction pattern, a dozen other well-known peaks in the spectrum will line up with their proper wavelengths.
This week I was pleased to see that a half dozen different calibrated spectra taken by Ebert of CFLs all lined up nicely with each other. But I was puzzled that they did not line up so well with a diagram of the 14 major emission peaks in a CFL. I made a set in Spectral Workbench of this result. The image above is one of the spectra in that set (SnowSky) with the 14 CFL peaks overlain. That spectrum was calibrated by telling Spectral Workbench the wavelength of the blue peak at 405 nm and the red peak at 650 nm (using the macro feature). The failure of many of the other peaks to line up properly suggests that the spectral images taken by Ebert are distorted. To align them properly, the image has to be rubber sheeted -- a non-linear adjustment must be made.
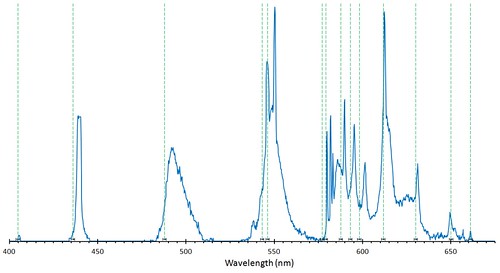 An intensity graph of the CFL spectrum above which was calibrated just by anchoring two peaks, one near either end. Many peaks do not line up with the well-known peaks from CFLs (green dashed lines).
There has been some good discussion about calibration at the plots-spectrometry Google Group, where I learned about the technique that I describe below for fitting a second order polynomial to adjust the calibration spectrum above so it matches the proper peaks more closely. I used the cursor readout in Spectral Workbench to find the wavelength of each of the 14 peaks in my poorly calibrated spectrum above. I knew the correct wavelength of these peaks from sources like this. Excel has a function (=LINEST() ) which will do this multiple regression properly and compute such things as the F statistic, but if you just make a scatterplot graph of the 14 wavelengths of the poorly calibrated peaks (x) against the 14 known correct wavelengths of those peaks (y) and fit a second order polynomial "trendline" to the points, Excel will print the equation for you. In this case the equation was:
y=0.0002x2 +0.8394x+37.788
where x is the old lousy wavelength and y is the new adjusted wavelength
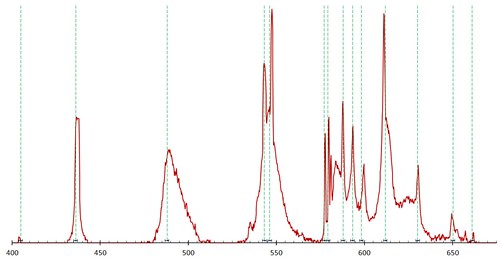 An intensity graph of the same CFL spectrum above which has been adjusted by fitting a second order polynomial to the wavelengths. The peaks are closer to the known wavelengths of those peaks (dashed lines).
Applying this function to each old wavelength shifted the spectral graph in the right direction, but was not as satisfying as I had hoped. So I got rad and clicked "Format Trendline" again and went for a third order polynomial. That improved the fit some more and probably as much as it needs. I will have to live with the remaining errors (at least until I figure out what causes them).
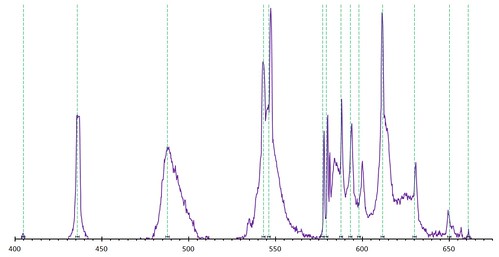 An intensity graph of the same CFL spectrum which has been adjusted by fitting a third order polynomial to the wavelengths. The peaks are as close to the known wavelengths (dashed lines) as they are going to get.
Now that I have this function (y=-0.00000141x3 +0.0024x2 -0.376x+250.15) I could apply it to all the spectra taken with Ebert. So when I capture a spectral image of an unknown light source, the peaks will be more accurately aligned on the wavelength scale and be more reliable clues about the atoms or molecules producing or modifying the light. It would be great to have this functionality in Spectral Workbench, so if you would like to help with the programming, get in touch.
4 Comments
I am guessing that what you are seeing is due to lens distortions from your camera. If this is the case, each different camera will have a different correction equation. To check this out you could take a picture of a ruler and do a similar pixel vs. distance comparison and see how (non)linear it is.
Reply to this comment...
Log in to comment
That would be very good news if the problem was lens distortion, because that can be corrected with a single click. I will look into that. The image of the diffraction pattern is centered in the photograph, and spans only a third of the photo's width. The lens is zoomed in to 9.64 mm from its widest focal length (6 mm). So there should not be too much distortion.
I fear that the flimsy grating film, which is not exactly flat, contributes to this issue. One nice thing about a DVD grating is that it is stiff and flat.
But it sure is nice to have a problem which can be solved with math. #sleepwelltonight
Reply to this comment...
Log in to comment
Hi Chris, for the upcoming "root mean square error" calibration "fitness" test, I want to sample not every single point, but all the peaks and troughs (to save time) and/or all the midpoints of plateaus and trough-plateaus. Were the points you used in your polynomial significant points? Just well-known peaks? What if I used all of those, and then the midpoints between them? Can you share which points you used?
Is this a question? Click here to post it to the Questions page.
Reply to this comment...
Log in to comment
Oh, sorry, to be clear, i just need the wavelength values.
Reply to this comment...
Log in to comment
Login to comment.