
Lead image: Whatcom Creek in Bellingham, WA, Robert Ashworth, CC BY
Purpose
We'll use existing state-reported data to learn about the health of local waters and whether they're safe for activities like swimming, fishing, and drinking. Under the US Clean Water Act, each state must monitor water quality in waterbodies and waterways within their borders. Waters that fail to meet the state's water quality standards are "Impaired Waters," and the state must report a list of its Impaired Waters to federal agencies every two years. Information about impaired waters is publicly available through federal and state databases.
This activity is based on tips shared by Courteny Morehouse, an environmental planner with the Berkshire Regional Planning Commission in Massachusetts. Thanks, Courteny!
Materials needed
- A computer/tablet with a connection to the internet
Steps
Using the "How's My Waterway" search tool from the US EPA
How's My Waterway is "a user-friendly search tool that retrieves state-reported water quality conditions from EPA data systems for a user-defined local search area. It allows you to see if your waterway was checked for pollution, what was found and what is being done." (US EPA)
Step 1
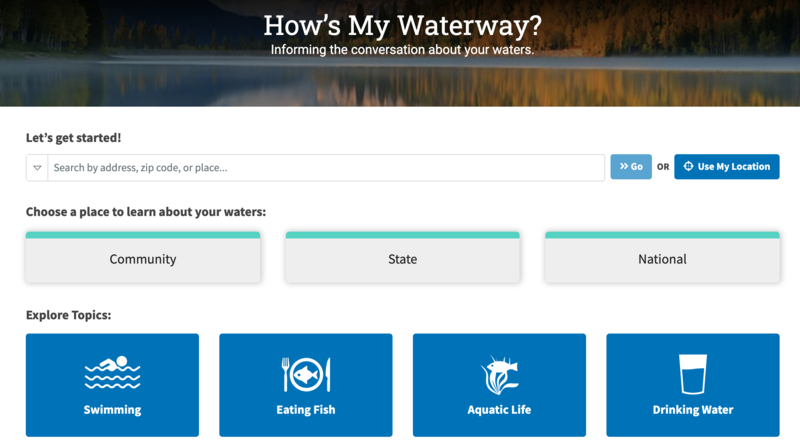
Visit the "How's My Waterway" website at https://mywaterway.epa.gov/
Step 2
Choose a place to view by entering an address or location in the search bar. Or, view water conditions more generally by community/state/national level, or by topic.
I entered Bellingham, Washington, into the search bar and got the result shown below in step 3.
Step 3
View information on the Overview tab. There's a lot of information already here! The map on the left shows the region being described in the Overview panel on the right. The watershed name appears at the top ("Lower Whatcom Creek"). I switched on the "Monitoring Locations" and "Permitted Dischargers" toggles to make them appear on the map (purple squares and orange diamonds, respectively).
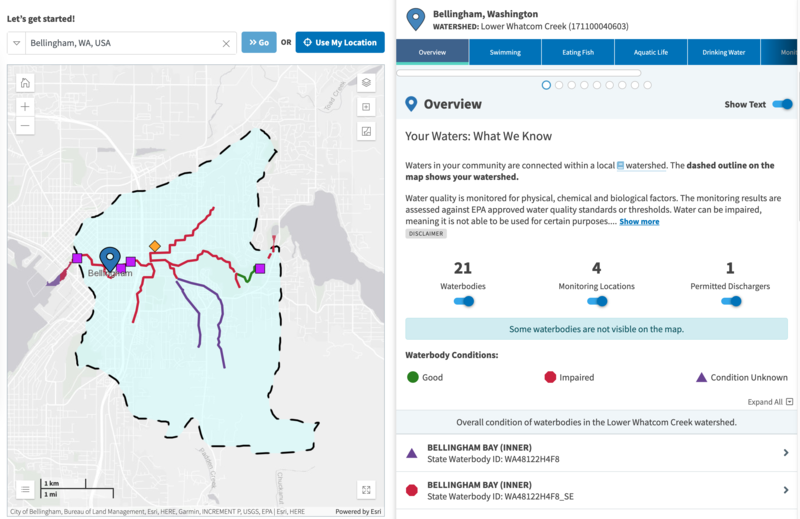
Map of waterbodies in the search area and an overview of water conditions
The map shows specific waterbodies, color-coded to their condition: green for good, red for impaired, and dark purple for unknown. Not looking so good over here 😦.
The waterbodies are also listed by name on the right. Clicking on a listing will open up a summary of the waterbody condition.
Step 4
Select a specific waterbody and view its results. I'm interested in learning about the condition of a creek running right through downtown Bellingham. Salmon swim up the creek every fall, and sometimes people fish in there.
On the map, I turned on the streets basemap to locate the creek more easily. Use the "Expand" menu in the top right of the map to access different basemap layers, like satellite imagery or topography. There are also other layers you can display, such as demographic data and congressional districts--handy if you want to know who to contact about your local watershed.
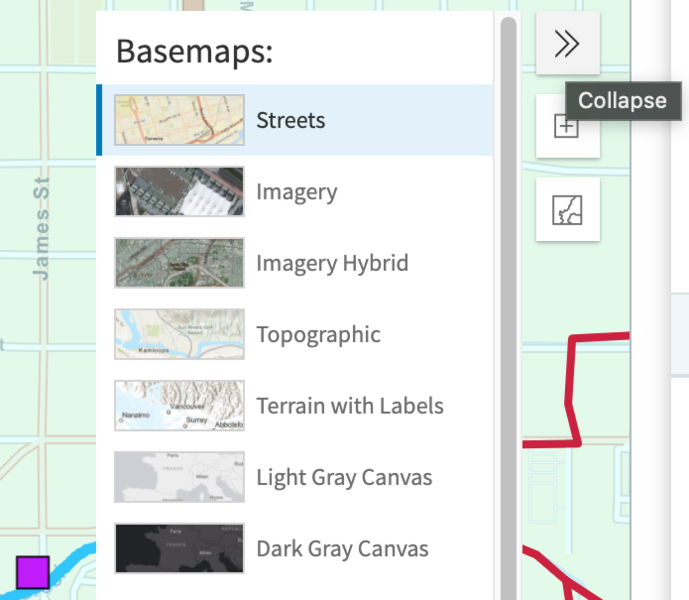
Adding basemap layers
Click on a waterbody to highlight it in blue and bring up a summary of the waterbody. What you'll find on the summary card:
- Waterbody name
- The year data was last reported (2012 for this creek! I did find more recent data in other states)
- Whether the waterbody is in good or impaired condition for different uses
- What water quality problems were identified = impairment categories. Clicking on a category brings up a small window with a definition and what you can do about it. Neat!
- A link to a longer waterbody report
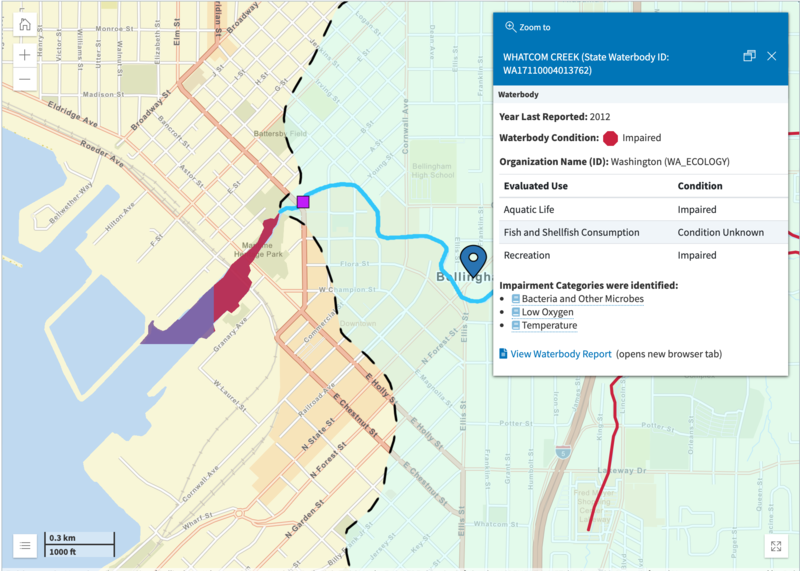
Viewing water condition results for a specific waterbody
This creek is impaired for recreational uses, but it wasn't assessed for whether it's safe to eat fish caught there. Hmmm.
Step 5 - Optional
View waterbody conditions by specific uses or impairment issues. Select the different tabs in the right panel to display map results for swimming, eating fish, or the health of aquatic life. There's also information on drinking water, and the different impairments throughout the watershed.
I selected a different neighboring waterbody to see what areas were assessed for eating fish. In Lake Whatcom, nine areas were assessed for eating fish and all were found to be impaired. For a couple of the more populated areas in the north side of the lake, mercury, pesticides, and PCBs were found as impairments in 2012.
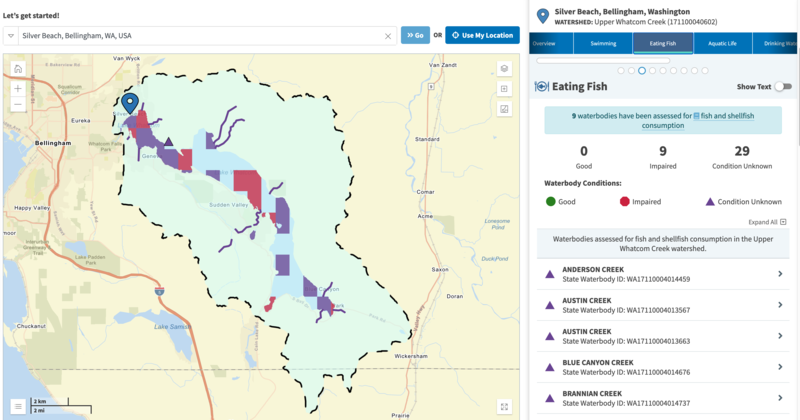
Viewing waterbodies assessed for seafood consumption
If you choose the "Identified Issues" tab, you can view water conditions by impairment. Back in the Lower Whatcom Creek watershed, I selected only "Bacteria and Other Microbes" as the impairment category, to see where there might be issues with wastewater (possibly leaky pipes, untreated sewage).

Viewing waterbodies with impairments of bacteria and other microbes
Step 6 - Optional
If you want to know more about the waterbody conditions and plans to improve water quality, view the waterbody report. From a waterbody's summary card or listing, clicking on the link to "View Waterbody Report" will open another browser window with a more detailed report. There's information on the impairments and links to restoration plans for impairments.
Whatcom Creek, for example, is impaired for recreational use because fecal coliform is present (the "Bacterial and Other Microbes" impairment listed above). As of 2012, there was no restoration plan in place for this impairment, though.

Waterbody Report for Whatcom Creek
Wrap up
Follow up activities
- Pair the water quality information you get from databases with aerial and topographic imagery of the area you want to know more about. Look for signs of potential pollution sources nearby (for example, industrial facilities, large agricultural fields), especially upstream and uphill.
- Potentially find more detailed information from a state database. For instance, the Washington Department of Ecology also has an interactive mapping tool to find water quality reports for local waterbodies. I found it much less user-friendly than the EPA's How's My Waterway tool, but it did have more information on water testing history and results. If you're having trouble finding information, some terminology to look out for is the "303(d) list," which is the list of Impaired Waters.
Does your state have an easy-to-use water quality mapping tool? Please let us know in the comments below!
Remaining questions
- Why is the reported data for these Bellingham watersheds so old?
References and additional resources
- Watch a recorded webcast of how to use How's My Waterway here, from the US EPA Watershed Academy. This video covers MANY more features of How's My Waterway.
- Resources, Tools and Databases about Impaired Waters and TMDLs, from the US EPA. TMDLs stands for Total Maximum Daily Loads, "the maximum amount of a pollutant allowed to enter a waterbody so that the waterbody will meet and continue to meet water quality standards for that particular pollutant."
If you have any other ideas or tips to add to this activity, please comment below!
0 Comments
Login to comment.