.png")

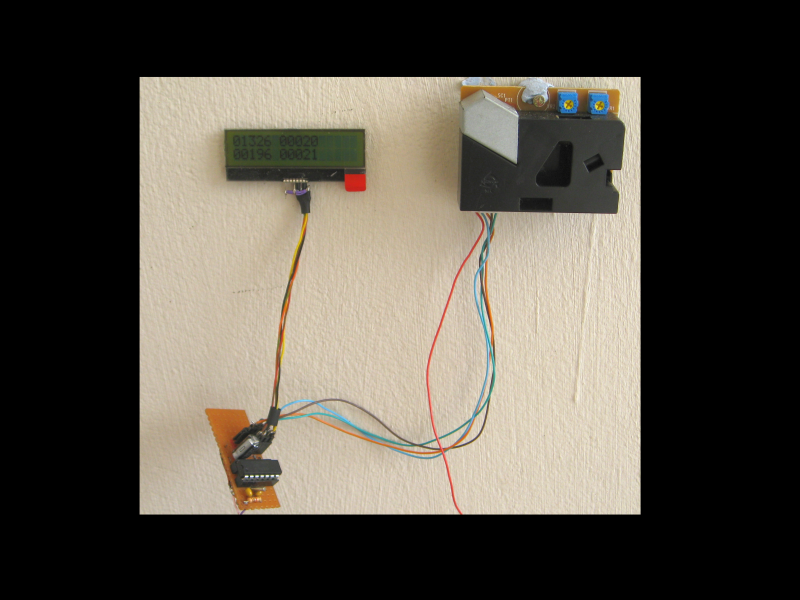
The device uses a STBM271 (from Rapid Electronics). It is very much the same type of device that has been used by others (under different names) and uses light scattering to measure particle number and size. There are two channels one was set to >1um and the other was fixed at >2.5 um.
The length of the pulses from each channel were compared to get an idea of the difference in sensitivity. The more sensitive channel gave pulses (for a given particle) 4 times longer so the readings from the more sensitive (>1 um) were scaled accordingly.
I think the factor of 4 comes from the volume to suface area ratio of 1um and 2.5um (2.5 to the power of 1.5 =3.95).
The time is taken from a clock crystal and is fed into 3 16-bit counters in the microprocessor. one counter runs freely the other two are gated by the output from the channels of the dust sensor. The readings from the counters are accumutaed fro 512 seconds for each data point.
There is sufficient flash memory in the microprocessor to collect readings from the two channels for 6 weeks. Presented (top) is the data for the >2.5 um channel (average value over 6 weeks 17 ug/m3).
The graph seems to have lost most of its resolution on upload. There is a peak in particulates between about 9am to 12 noon and a rather strange low period in the early afternoon which may be an artifact due to changes in wind speed/temperature.
7 Comments
What is your unit scale reading on the output (y axis)? I can't get a clear visual, but it appears to be something other than micrograms/cubic meter.
Is this a question? Click here to post it to the Questions page.
Reply to this comment...
Log in to comment
It's going from 0-250 ug/m3 (and the x-axis is 42 days).The average value (over 6 weeks) is 17 ug/m3. So the graph shows there are some large spikes (going over 250) but these are not very short lived. I don't know they could be spurious electrical noise but many graphs I've seen show similar low background with large spikes. I've moved the device to a new location so I will see if the readings stay the same. It's a pity the graph lost most of its clarity when I uploaded.
Reply to this comment...
Log in to comment
This sensor can also be used with an Arduino which allows you to create a data logger but you probably knew that. I see that you have it talking to a PIC. Are you familiar with the new Teensys?
Is this a question? Click here to post it to the Questions page.
Reply to this comment...
Log in to comment
I've come back to this after doing a bit more research on the subject. First as the device has sensitive op-amps which are exposed I have put an electrical shield over the component board. This has removed the large spikes in the data. Second in order to get PM 2.5 values I need to get the concentration of particles <2.5 um. So as there are two channels >2.5 um and >1.0um taking the >2.5 channel from the >1.0 channel should give an idea of the particles which have size from 1.0 um to 2.5 um (all detectors have a cut-off at some lower value - which often the datasheet does not mention. The rather more expensive Sensiron SPS30 has one of the best cut-offs at 0.3 um). So here is the output for about 9 days. I have also "damped" the response digitally to make the graph less "spikey". The large peak starting Sunday into Monday is due to a Sahara dust event. The y-axis is ug/m3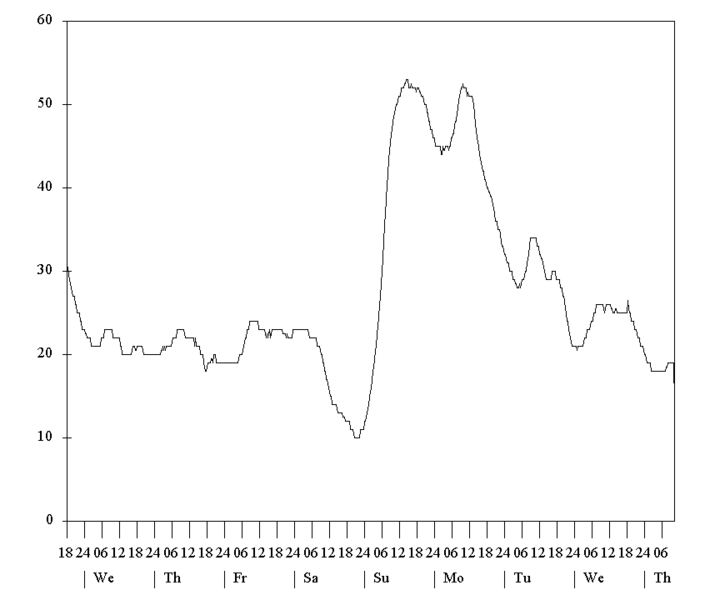
Is this a question? Click here to post it to the Questions page.
Reply to this comment...
Log in to comment
Where is this sensor located?
Is this a question? Click here to post it to the Questions page.
Reply to this comment...
Log in to comment
I am in Trinidad and Tobago. I have located the sensor outside, but sheltered from the weather. I am towards the eastern side of Trinidad and with the wind always blowing around easterly I will not be getting much in the way of pollution. It will be manly aerosols coming across the Atlantic, I feel (and maybe salt aerosols from the ocean).
Fascinating!
Reply to this comment...
Log in to comment
Login to comment.