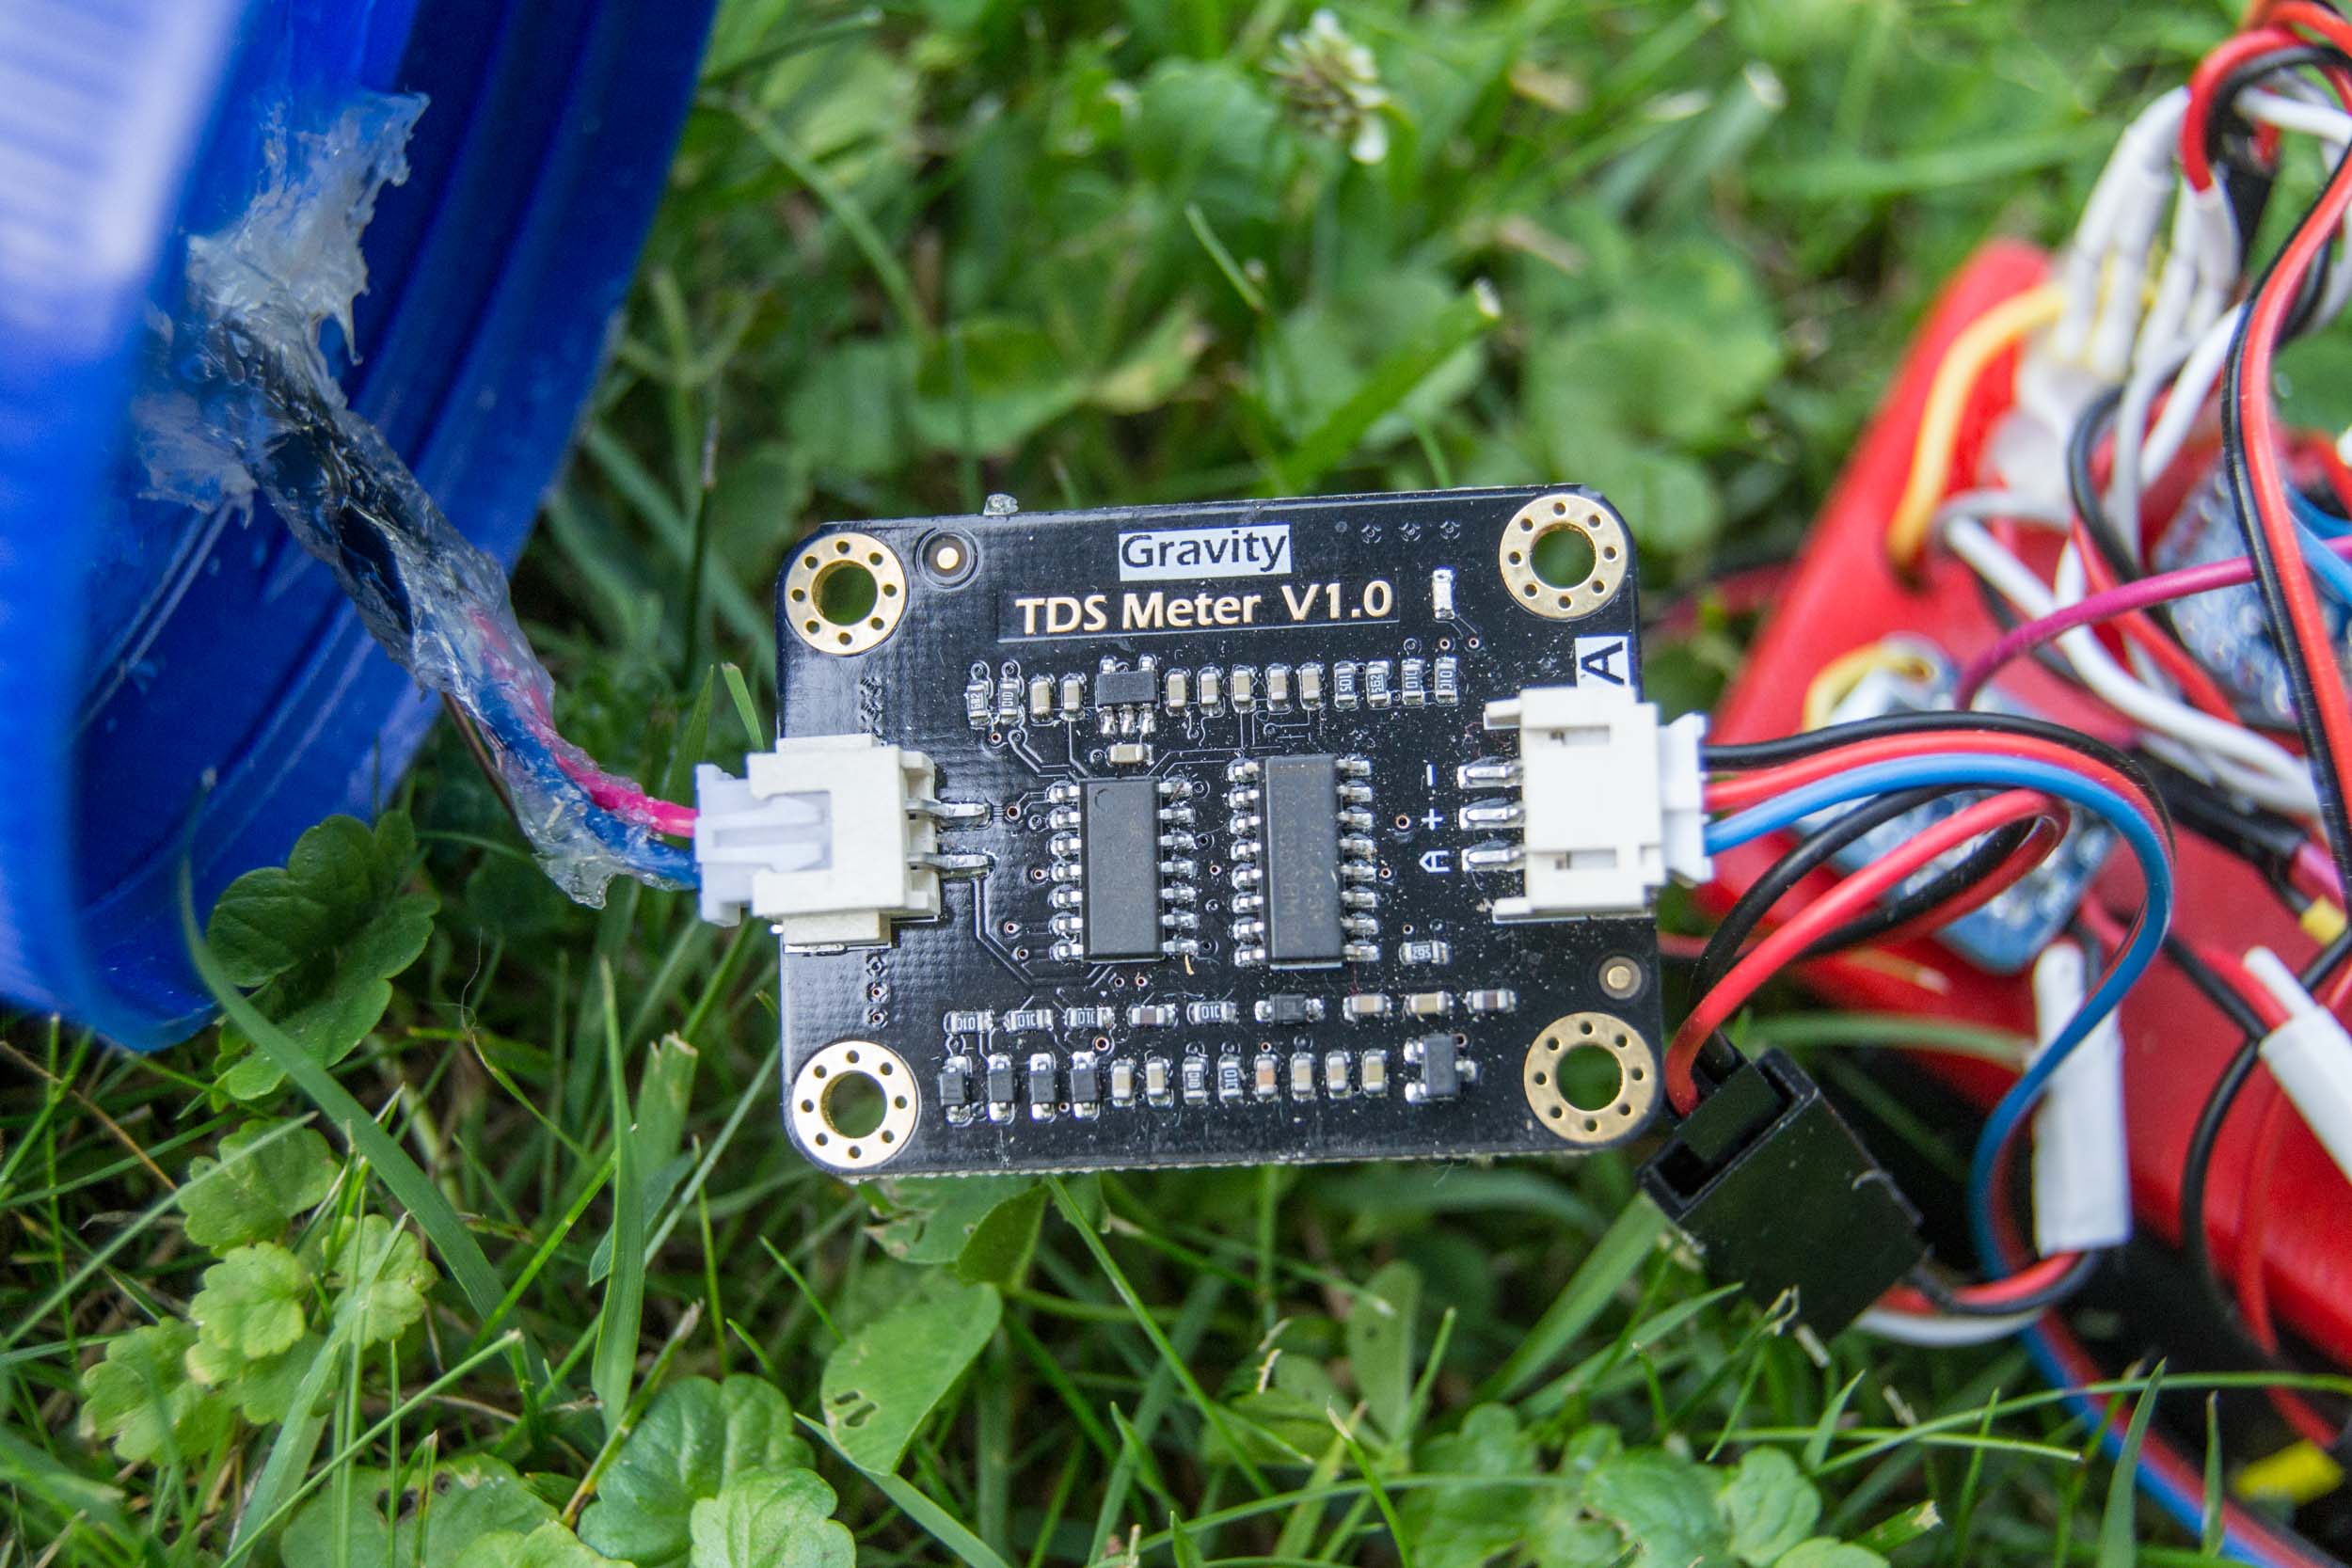
A few people at Public Lab have expressed interest in the DFRobot TDS sensor for Arduino data loggers. This sensor measures the electrical conductivity of water and the analog result can be converted to an estimate of total dissolved solids (TDS). TDS is a common measure of how much material is dissolved or suspended in the water and can be used as an index of water clarity or contamination. The sensor includes a waterproof probe and a circuit board (see main image above). One of the things the circuit board does is produce an alternating current to send to the two electrodes on the probe. This prevents the polarization that happens with direct current which can compromise conductivity readings and corrode the electrodes.
Figure 1. A Mini Pearl Logger (on red plate) prepared with an enclosure (peanut butter jar) and two sensors. A DFRobot TDS sensor and DS18B20 temperature sensor (left) are connected to the logger.
An outstanding feature of this product is that it costs only $12.90. This is a bargain compared to other conductivity sensors including DFRobot's conductivity sensor which costs $70.00. This price disparity suggests that there is something insufficient about the TDS sensor compared to dedicated conductivity sensors, and I have no idea what this deficiency is. So some testing is required to learn if the inexpensive TDS sensor can provide meaningful results.
I have not done enough testing to know how useful the TDS sensor is, but I have some preliminary results and a warning about the Arduino sketch (program) which DFRobot provides. The Arduino sketch is fragile and appears to have an error.
Figure 2. Sensor cables were passed through holes in the jar lid and then sealed with silicone goop.
As is common with inexpensive environmental sensors, it helps to read the sensor multiple times in quick succession and use an average to account for noise inherent in the sensor. The DFRobot code uses an IF statement to make these multiple readings every 40 milliseconds. Then another IF statement determines if enough time has elapsed to have collected enough readings and if so computes the median which is used to get a final TDS result.
Figure 3. The data logger pod ready for deployment.
This approach requires good timing, and if the total elapsed time is not correct for the selected number of sensor readings, the final result can be computed before a complete new set of sensor readings is acquired. That is the fragile part.
Figure 4. Both the DS18B20 (top) and TDS sensor (bottom) are waterproof, but I added a layer of heat shrink tubing around each and used silicone goop to improve the seal.
The error in the sketch also relates to this timing issue. The number of sensor readings to be taken is a variable which can be changed by the user at the top of the sketch, but the total elapsed time for making the readings is just set to 800 milliseconds deep in the code. For an interval of 40 milliseconds, 20 sensor readings will take 800 milliseconds, but the variable for the number of sensor readings is set to 30. So as written, the sketch computes a result before 30 new sensor readings have been made and includes older readings from the last cycle (which are blanks as the sketch starts). This seems easy to fix (change the 30 or the 800), although the approach assumes that the microcontroller will take exactly 40 milliseconds to make each sensor reading which I guess might be a safe assumption but I'm not sure.
Figure 5. The data logger pod deployed in the spring house. The cable on the DFRobot TDS sensor is only about 30 inches long, so the data logger had to be suspended so the sensor would be underwater.
Potential problems with the fragile timing-dependent approach are not critical when the goal is to display a result on the serial monitor. But my goal is to make multiple (e.g., 30) quick sensor readings, compute a single result, and save it to SD card. Those 30 readings should be completed sequentially and then used to compute the result. I am using a Mini Pearl Logger controlled by a low-power timer (TPL5110) which turns the logger on every 12 minutes and saves one result. The main loop in the Arduino sketch is run only once, so the code must do all its work in one pass. Therefore I had to modify the DFRobot sketch which assumed that the main loop would be run repeatedly.
Figure 6. Spring house water data for two days. Water level in the spring house was measured with a laser rangefinder and logged by a Mini Pearl Logger (top). Two periods of heavy water use are indicated. Another Mini Pearl Logger recorded TDS and water temperature (bottom) for the same two days. One period of lowered TDS followed sustained household water use which increased flow through the spring house. Note that the variation in TDS and temperature are numerically small.
Although computing the mean for multiple sensor readings is easy, the DFRobot sketch computes the median instead. They apparently found that the skew in the distribution of multiple values from this sensor makes the median a better measure of central tendency. Computing the median requires saving all the readings in an array, sorting the array, and finding the value in the middle. While trying to figure out what all this code was doing, I rewrote it to compute the mean instead of the median and to do it with a tidy FOR loop instead of the two timing-fragile IF statements. I don't know how my mean-based results differ from median-based results, but I suspect the difference might be irrelevant to my application of the sensor. So I will continue to use the mean instead of the median unless I learn that the median is much better. My sketch is a lot easier to understand and is designed to work with a logger that turns itself off after each single pass through the main loop.
Figure 7. Spring house water data for 30 hours. Water level in the spring house was measured with a laser rangefinder and logged by a Mini Pearl Logger (top). Three periods of heavy water use and one rainstorm are indicated. Another Mini Pearl Logger recorded TDS and water temperature (bottom) for the same 30 hours. During this period, increased water flow through the spring house was not associated with lowered TDS. Note that the variation in TDS and temperature are numerically small.
The Mini Pearl Loggers used here will soon be available as kits in the Public Lab Store. Until then, kits to build this and other data loggers are available at the KAPtery.
Here is the sketch from DFRobot: TDS.txt
Here is the sketch I have been using: MiniDS18TDS_1.3.txt
5 Comments
What do you guys think, is it okay to use the mean instead of the median?
@pdhixenbaugh, @MadTinker, @Shanlter, @rockets
Is this a question? Click here to post it to the Questions page.
Reply to this comment...
Log in to comment
@cfastie FWIW I used a Kalman filter algorithm for my TDS analyses with data from a similar setup data logger setup. I believe that my original implementation used the median but eventually ran into issues with timing and filling the array. There aren't significant speed or storage space issues. For me it was finding the interval that filled (a smaller array) and the power on interval. I am eventually going to go back to the median and work out the timing issue because I feel that for my application the median is the better estimator for TDS. From what I gather from your application, the difference should be unimportant UNLESS you experience rather extreme measurement values. Since the variation in TDS measurement is so small (relatively) than there is a good likelihood that the bias is insignificant.
A very simple check for your application is to monitor both on a test run and check if the bias is significant. print out the array values and calculate mean and median off-line. plot the difference.
Reply to this comment...
Log in to comment
@cfastie I have 6 weeks (weekends) to get this set up and running for the lake at my summer camp. I don't have the low power timer, but I am going to be seeing if I can adapt the code to use the RTC on the Riffle for that purpose. I'll let you know how it goes -- if you know of anyone doing or who as done something similar, let me know :)
EDIT: One difficulty I'm running into is understanding how to interface with I2C sensors with the Riffle -- even as basic as the pin numbers to use. I am referencing these resources:
[img]https://raw.githubusercontent.com/OpenWaterProject/riffle_328-rtc-and-low-power-operation/master/pics/rtc_pin.png[/img] https://github.com/OpenWaterProject/riffle_328-rtc-and-low-power-operation https://github.com/OpenWaterProject/riffle_328-i2c/blob/master/riffle_bmp180.ino
The bmp180 is an i2c sensor, but I'm having trouble understanding the ``` // Set the pins used #define cardSelect 4
#define chipSelect 7 #define SDpower 6 ``` section and how it corresponds to the circuit board. It seems like the riffle should be using pin 11 for scl, 9 for sda, 3 for 3.3V, and 1 for GND.
Low power operation:
To run your data logger for a long time on small batteries, you can put the Arduino and other components to sleep between logging events. Any logger based on an Arduino Pro Mini (328p) can be put to sleep effectively, but getting the batteries to last a month requires getting a lot of ducks in a row. The Riffle has two advantages over some other 328p Arduinos:
1. It has a physical switch which disables the USB circuitry (which is a power hog)
2. It has a mosfet which can be programmed to turn off the micro SD card slot (which can be hard to make sleep well) between logging events.
The low power link you include in your comment might be a good resource for programming a Riffle to sleep. The code posted by Kina Smith might be the best implementation of the sleeping capabilities of the Riffle. I never got very far sleeping the Riffle but got a $2.00 Arduino Pro Mini to log data every 15 minutes for seven weeks by sleeping everything and by doing several other things (Table 1 in that note). The sketch I used is linked there. Mashing up that sketch and the one linked to this note (plus some Riffle specific code if needed) could provide what you need.
I2C sensors:
I think the lines of code you included in your comment are associated with the SD card, not an I2C sensor. Unless there is some unusual code in the sketch, I2C sensors can be connected to pins A4 and A5 (SDA to A4, SCL to A5, [plus power and ground]). I don't see any code in the sketch you linked to that would prevent pins A4 and A5 from working with an I2C sensor.
It should be pretty easy to set you up with code that runs a Riffle or other 328p Arduino and logs the data you need.
Chris
Reply to this comment...
Log in to comment
Were you ever able to see how the TDS data given by the sensor compared to the actual TDS level of your water?
Is this a question? Click here to post it to the Questions page.
Reply to this comment...
Log in to comment
Login to comment.