Oil testing kit Blog

Working Oil Testing Event Guide
This post is a working document on the developing Oil Testing Kit Event Guide. I expect it to change and adapt as we refine our techniques. Please post comments and feedback. This is the event structure we followed for the Oil Testing Event on 7/31/14.
Oil Testing Exploration Event
Resources Needed:
- 4 long tables and a chairs
- 4 Computers
- 3 Working specs to attach to the computers with enclosing boxes (what you can fit the spec and your sample in to scan it in a dark space, make a hole for the laser to go through) (These can also be cell phone specs)
- 10 or so collection bottles (pre filled with mineral oil)
- stickers to label your samples
- swabs for the samples
- 4-5 uv lasers
- markers and pens
- sticky notes
- 4 poster boards
- gloves
- paper towels
- a camera (to document)
- news paper (to protect your table)
- bio jar
- paper research notes
- ***If you want to make available for people to work on developing their own spec designs you will need materials such as: scissors, exacto knives, glue, tape, a plastic board to cut on and chip board. (we had these materials but found that everyone was more interested in working with the existing specs)
Setting up the event:
Setting up the room:
1) Line up the four tables with room for people to work on either side of them. Put up a poster board behind each table with the words “Notes, Questions and Ideas” and label them in order additionally with: Construct, Collect, Scan, Compare. 2) Put post-its, markers and pens on each table. 3) Put copies of the hand written research notes on each table for people to include more in depth information on what they explored. 4) Put a few chairs around each table (some people do prefer to stand and work especially around the first table).
Set up the 4 tables:

Table 1: This is where people can work to construct a spectrometer. This is where you would have your construction materials set out and any spec kits you have that can be assembled (cell phone or desktop). This is also where I had a spec kit laid out in order of how you would put it together showing each stage of construction (with the folded part already folded etc.).

Table 2: This is where you prepare your samples. The sample preparation table has the following materials: 10 or so collection bottles (pre-filled with mineral oil), stickers to label your samples, swabs for the samples, bio jar, gloves, paper towels, newspaper (to protect your table), a UV laser, optional samples that are already prepared.

Table 3: This is where you can scan your samples. Set up two computers on this table with two built spectrometers and boxes to scan. Get them logged on to spectral workbench.

Table 4: This is where people can compare samples. This table is similar to the previous one, people can scan them and compare them at this table. (We generally found that the computers and scanning took up a good bit of space so people did both steps at both of these tables.)

Event Structure:
Introduce the Event: 1) Introduce yourself, why you are interested in this project and a little bit about Public Lab. 2) Emphasise that the tools, technology and event structure is currently being developed and that the outcomes of this event are to explore all three and make them better. 4) Identify that we will walk through how you would do this at each stage together and then people can break off and work on pieces of it they find most interesting, this will allow for people to really delve into the different aspects of the project. 5) Highlight the posters, markers and sticky pads available for people to put up their questions, comments, ideas and things they explored while they were there.
Walk through the stages of the process: (a more thorough walk through can be found on this page) 1) At the first table you can explain a little bit about spectrometry, how you can use it to identify samples. 2) Walk through how you would build a spectrometer with your layed out version. 3) At the Second table, walk through how you would prepare a sample (you can demonstrate this). 4) Use the laser to test if your sample is floressing, if it needs to be diluted or made stronger etc. 5) At the third table, show how you would scan a sample. 6) Point out tools on spectral workbench, the flip and the compare functions especially.
Jump in:
Invite people to pick a table, a part in the process they are most interested in and delve into that they find on it. Remind them to experiment, take notes on the poster board and on their research notes and to have a good time! Don’t forget to take pictures. They help with documenting your event and the processes.
Conclude:
Go over what people are exploring, review with everyone what people have posted on the boards or wrote on their research notes. Allow people to take the notes with them if they want to do an online write up, but be sure to photograph them first just in case! Be sure to thank everyone for coming and invite them to your next event!
After your event:
Take pictures of the posters. Scan in the hand written research notes that you collected. Document what you explored in your event in a Public Lab Research Note include your pictures. Don’t forget to tag it with the tags: #spectrometer, #workshop, #oil-response-toolkit, #oil-testing-kit
Follow related tags:
spectrometer community workshop oil-response-toolkit

Survey of different kinds of fluorescence spectrometry, optimizing intensity
Jargon
Learning more about different types of fluorescence spectroscopy -- a common type for oil analysis being (Synchronous) Scanning Fluorescence Spectroscopy (a real mouthful) or SFS, which involves illuminating the sample with monochromatic light at ~5-20 nanometers shorter wavelength than where you're reading it. The light source and sensor both move up (or down?) the wavelength scale at a fixed distance, hence "synchronous scanning".
I believe the type we're doing is called LIFS, or laser induced fluorescence spectrometry. I'll be looking at LIFS literature more to see what we can learn despite the intense jargon!
There's also three dimensional excitation- emission matrix (EEM) spectroscopy, apparently also a form of fluorescence spectroscopy. All three, according to Elfrida Carstea in "Fluorescence Spectroscopy as a Potential Tool for In-Situ Monitoring of Dissolved Organic Matter in Surface Water Systems", can be used "to estimate water pollution and to probe the composition of DOM in watersheds." DOM apparently means Dissolved Organic Matter. Interesting! We're looking for oils, but good to know -- both as a possible future alternative use and as a possible false positive if there is organic matter in our samples.
Data types
Each type of spectroscopy outputs a different sort of graph; the type we're using (laser induced fluorescence spectroscopy) has a characteristic spike where the laser light is read, because it's so bright. You can see that in a) in the below diagram, from the Carstea paper:

Synchronous scanning fluorescence, in b), lacks the spike because the light is never emitted at the same wavelength as light's being measured -- it's always just 5-20 nm out of "view".
Total synchronous fluorescence is 2d, I believe because it measures an entire spectrum for each narrow wavelength of light that's used to illuminate the sample. So you light it up with 400, 405, 410nm, and take a whole spectrum each time. Lots of data! We haven't used monochromators (which are like a reverse spectrometer and can generate any color of light) so we haven't tried this. It sounds like a lot of work, but building a monochromator wouldn't be hard.
Fluorescence intensity
Sometimes it's tough to know what's "common knowledge" among practitioners -- Carstea mentions that:
The fluorescence response is highly affected by solution temperature, composition, concentration, pH and salinity.
Whoa -- we've never tried cooling or heating samples -- we should definitely try it. And adding an acid. And Carstea indicates later that it's low temperature that increases intensity.
Citations
Carstea, Elfrida M. "Fluorescence Spectroscopy as a Potential Tool for in-situ Monitoring of Dissolved Organic Matter in Surface Water Systems." Water Pollution 1 (2012). http://scholar.google.com/scholar?cluster=1158389149894948890&hl=en&as_sdt=0,22
Follow related tags:
spectrometer fluorescence pesticides literature

Visible-range fluorescence fingerprinting of heating and motor oil
I forwarded this 1992 article, "Fingerprinting petroleum contamination using synchronous scanning fluorescence spectroscopy," around a while ago (and posted on the wiki) but it's open access and there's a particular section that's really great and related to our Oil Testing Kit.
Synchronous Scanning Fluorescence Spectroscopy
(jargon warning) In the paper, they're discussing Synchronous Scanning Fluorescence (SSF) spectroscopy, which is where you shine a light into the sample that's 5 nanometers shorter wavelength than where you measure, and you scan up the wavelength scale. It lists some advantages (here I quote):
- simplification of the spectral profile
- sharper peaks resulting from spectral bandwidth reduction
- less background because of a reduction of scattered light
It's not clear to me if the bandwidth referred to for sharper peaks is exitation or emission bandwidth.
I want to find an article on non-scanning fluorescence, because that's what we're doing -- one line in particular worries me in this report:
In normal fluorescence of complex samples like gasoline, the sample is excited at 254 nm, with the resulting fluorescence emission spectrum consisting of a rather large and indistinct peak. This makes it impossible to identify one gasoline sample from any other grade or brand of gasoline (see Figure 1). However, SSF spectroscopy may be used to simplify the spectrum by reducing the spectral bandwidth as seen in Figure 2.
I think "impossible" is an overstatement here, and we're looking at much heavier petroleum products, like crude and motor or fuel oil. Surfrider has used normal fluorescence curves to distinguish crude from dispersant. But we'll have to demonstrate that there's enough differentiation that we can tell our samples apart.
Wavelength range
Some plots in the article show down to <300nm, but several also show good data in the 400-700 nanometer range, which is what our device can do. Tetracene, for example, is cited as being entirely between 460 and 600nm.
Case studies
This is the best section, especially the one with the graph shown here:

Here, we see used motor oil, fuel oil and an unknown. Again, SSF, but in the right wavelength range.
Aging of samples
The paper also discusses old vs. new samples, and says that after 3 months there was no noticeable difference -- hard to say if this is true for all types of samples, but it's encouraging.
Pharr, Daniel Y., J. Keith McKenzie, and Aaron B. Hickman. "Fingerprinting petroleum contamination using synchronous scanning fluorescence spectroscopy." Groundwater 30.4 (1992): 484-489.
http://onlinelibrary.wiley.com/doi/10.1111/j.1745-6584.1992.tb01523.x/abstract
Follow related tags:
spectrometer oil fluorescence matching

State of the Science: The Oil Testing Kit
What we want to do
I sat down with @warren to record a video presentation on the state of the oil testing kit development. I would like to make videos like this about all the tools in development with Public Lab, contact me if you'd like to work on one.
how we did it
I grabbed a video mixer recently to let me do live editing of presentations like this. We plugged in a bunch of equipment we already had , and audio recorder for the sound, a point and shoot for the video, and a linux laptop as an image source (running a google presentation. These went into the mixer and then into my Mac for firewire video capture. Then took multiple takes live. Maybe its trivial, but I really like the newscaster-style video in the corner, I think it makes a powerpoint-style presentation more compelling.

Questions and next steps
The point and shoot was a crumby video source. I also tried HDMI out from my phone, but the aspect ratio change from 16:9-4:3 looked bad. I'm working on sourcing better HDMI to component YUV video to up the video quality.
Why I'm interested
Public lab folks do lots of presentations. I want to capture them in a compelling way!
Follow related tags:
spectrometer video oil-testing-kit with:warren

Hardware design work for the Oil Testing Kit
A hardware sketch of our favorite configuration is above. _This is a jointly authored research note. _ @mathew, @stevie, and @warren worked on Thursday on a design for the Oil Testing Kit, which could eventually replace the Desktop Spectrometry Kit. This was based on previous work by @mathew and @warren, but culminated in some great new ideas.
Main goals
Our main goals were:
- reducing # of, or simplifying assembly steps
- adding a sample chamber
- adding UV light source
- simplifying alignment of the light source with the sample and slit
- improving rigidity/weatherproofness/robustness
We also want to try:
- increasing moddability (for power users)
- maintaining or lowering cost of materials (vs. $40 kit)
- lowering weight (which should be easy by dropping the aluminum conduit box)
- combining best of foldable and desktop spectrometers
- reducing light leaks
- improving stability of phone attachment
- accommodating different camera positions
- unify smartphone and desktop kits in some or all features.
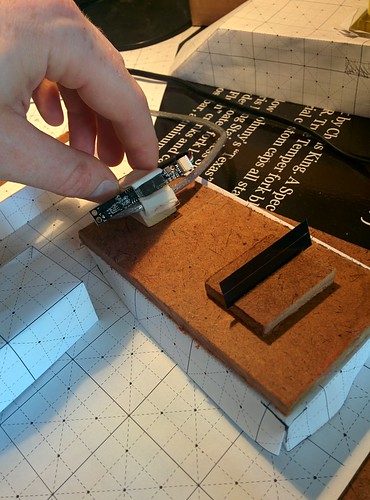
With @mathew pushing for a rigid "optical bench" style board where the slit, grating, and camera could be precisely and firmly positioned and affixed, we brainstormed using
- a routed channel and screw mounts,
- a peg board and small right angle aluminum struts pre-drilled,
- a measured grid and instructions printed on it.
- mini binder clips to affix bits of right-angle aluminum struts onto a small platform.
These last two ideas, a measured, printed grid with instructions printed on it for attaching right-angle struts with clips was our favorite. Binder clips are not ideal, but pretty close to what we want. We like the idea that as a flexible platform it not only accomodates modifications in the "optical bench" style-- it invites them.


In past designs, the laser was stuck in a hole next to the sample, so it was impossible to position consistently. Since getting it aligned is a big problem for getting enough light to the webcam, we'd like to fix it completely inside the box, and align it precisely at the best height. to capture the most light, we believe it should be parallel to the slit.
Parts
This is a draft -- and we're working to reduce the # of parts and simplify construction.
- bench - rigid (poplar, basswood, masonite?) sheet on which to clip all optical pieces
- frame - folded chipboard insert which holds the whole system together and provides key geometries
- baffle or envelope - to block light from the outside, matte black paper
- case or box - structural, relatively weatherproof, backpack-proof


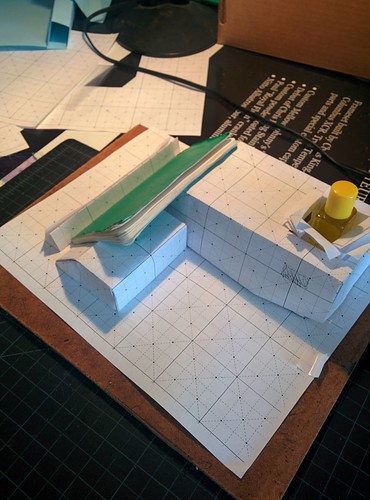
We're thinking about building the light-blocking housing into the spectrometer box. The box becomes a kind of 'sandbox' for setting up a lab setup. Two different strategies arose for the light baffle-- attached to the box, and free standing. We're split on the idea of a folding baffle, and will try a few strategies. Do we fully encase the skeleton or build it into the box?
Holding Lasers
Riffing on a support, the idea of a fold-up support that locks in place at the right height appears good. We'd like to fit the laser entirely within the box.


Earlier
Previously, @mathew & Jeff brainstormed and prototyped a 'skeleton and baffle' designs:
@warren riffed on the same idea with a foldable inside and a sampling station.

Follow related tags:
spectrometer kits fluorescence desktop-spectrometer

Recap: July 31 New Orleans oil testing meetup
Last night we held a meetup (organized by Stevie) to work on the emerging Oil Testing Kit with folks from the New Orleans area. Our main goals were to start connecting with local contributors and collaborators, and to prototype and improve the Kit itself -- especially the sampling methods.

Mathew ( @mathew ), Jeff ( @warren ) and Stevie ( @stevie ) set up four different tables based around the Construct, Collect, Scan, & Compare stages of the testing procedure, which helped to situate the workshop activities in the overall oil testing process. People could build and improve spectrometers, prepare samples, scan them in pre-built spectrometers, and compare the results at the four corresponding tables.


We also posted sheets with these four labels, inviting people to contribute to the research process by asking questions, listing problems, and making suggestions -- which helped to situate the activities in the overall research arc in the Public Lab community. Participants took the invitation-- we recieved good feedback and did not prompt participants to take notes and modify the instructions and procedures we presented.

Takeaways:
Both the "4 steps" approach to activities and the suggestion posters were a big success -- the event was informal, but still structured, and people asked important questions like "does weathering affect the spectra of oil samples?" and "why is it important to calibrate the spectra on spectral workbench?"
We had an idea for how to do this even better -- to print out "paper research notes" with a line for people to write their name or PublicLab.org username (for credit) so that the workshop itself is kind of like a real-life version of contributing to PublicLab.org. (it could include a Creative Commons notice at the bottom, too!)
Jeff ( @warren ) did a quick sketch of what this "Paper Research Note" could look like:

The process-based table layout was also great, and laying it out as a kind of timeline for the testing process itself really helped people understand where each step fit into the larger process.
Research questions:
Brightness
We struggled a great deal with getting enough fluorescent light from the sample to register on the webcams, although they seemed bright to the naked eye. We tried moving the laser up and down, left and right, but only ever got low (~10%) brightness... not really enough to work with and below the hoped-for 25%: https://spectralworkbench.org/analyze/spectrum/31699
Finally, we used a smartphone spectrometer which was much more sensitive (https://spectralworkbench.org/analyze/spectrum/31708), but didn't have a live interface like the webcam-based versoin. Going back to the Desktop Spectrometer, we added reflective material around the sample bottle which helped amplify the brightness, but was still not very satisfactory. It seems like we need to think about sourcing a more sensitive camera for the kit, perhaps?

Testing bought oil samples
One goal was to test some of the crude oil samples we'd bought online, for comparison. We used the new sampling bottles with a built-in brush (see below). Surprisingly, only a fraction of a drop was enough to get strong fluorescence, easily visible to the eye. But the brightness issues discussed above stopped us from getting clear spectra of them except with the smartphone spectrometer. We'll try to calibrate those and share them soon.
Swabbing tarballs directly
We had tried to test an idea to simplify the sample preparation process (and some new empty nail polish bottles we'd found) by cutting out the "soaking" step and just directly swabbing suspected samples with a mineral oil-covered brush. But with the tarball sample we had, we had difficult getting enough of the sample in the bottle just by dissolving it and rubbing the brush on it. It seems like a "soaking in oil" step to make a kind of dark slurry may be neccessary with some samples, so we can't always ditch the extra step. Too bad -- the tests in Portland weeks ago had suggested otherwise.

New sample bottles
We had purchused several types of new sample bottles, one that was a nail polish bottle with a brush included, one that was smaller with a cap and the origional bottles which are no longer being sold. We found that, although the nail polish bottles make taking samples easier with the brush included, there was a question that arose of whether the brush itself was fluorescing. Also, the bottle walls were slightly curved and we wondered if that scattered the laser too much. Suprisingly, we also found that when these beveled bottles were angled towards their side, the spectra sometimes came through more clearly. Perhaps the laser light that escapes from the bottle edges is directed away from the camera?
Issues lists:
We collected a great deal of comments, ideas, suggestions and issues:
- adding a reflective liner (from a sun chips bag!)
- a variety of suggestions for clarifying the instructions on the Desktop and Foldable spectrometer kits -- we'll post them as a followup note!
- we've collected and will address various calibration issues on Spectral Workbench: https://github.com/publiclab/spectral-workbench/issues/6
- the brushes in the nail polish bottles are gummed, so they should be thoroughly rinsed before use
- we put drops of the purchased crude samples, and chunks of the tarballs, on note paper before swabbing them, in order not to put mineral oil back into the sample bottles. This created some gross waste material.
- we discussed using ethanol, methanol, or other solvents instead of mineral oil but did not test this out
- there was a question that some of the specs might have had slits that were too narrow
Follow related tags:
gulf-coast spectrometer calibration workshop