
NDVI
What is NDVI? What is NRG?
We've been working a lot on capturing infrared imagery using our DIY near-infrared camera setup, and combining it with visible bands to produce NDVI images such as the one above.
What exactly are these images we're trying to make? What do they tell us about vegetation, and why? These diagrams should help to understand what it is we're doing and why these are good ways to analyze plant life.
NDVI stands for "Normalized Difference Vegetation Index". NRG stands for "Near-infrared / Red / Green". NDVI and NRG are both ways to visualize the amounts of infrared and other wavelengths of light reflected from vegetation. Because both these methods compare ratios of blue and red light absorbed versus green and IR light reflected, they can be used to evaluate the health of vegetation. It's a snapshot of how much photosynthesis is happening. This is helpful in assessing vegetative health or stress. (Read more here: https://www.agronomy.org/publications/jeq/articles/36/3/832)
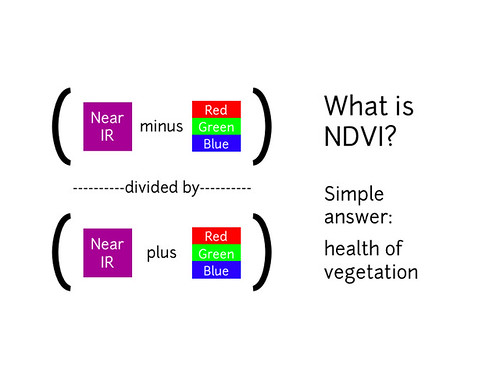
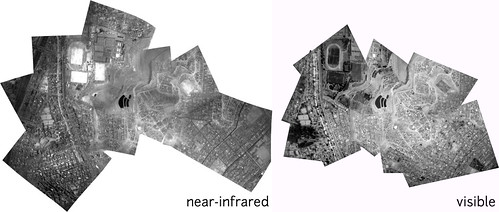
NDVI is a ratio which tries to emphasize photosynthesis while filtering out sun glare. The above equation is run for every pixel, using source data from an infrared photo and a visible light photo, like this pair:
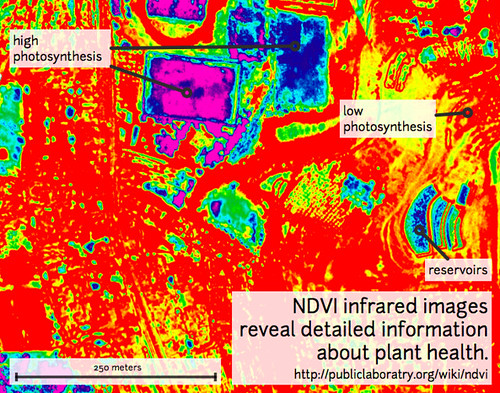
The result can be false-colored to make the high-photosynthesis areas more clear -- like the top image on this page -- and used to examine where plants are and how healthy they are.

NRG imagery
We're also interested in producing NRG imagery (like the above image), where Near-Infrared, Red, and Green are used to compose a picture instead of the usual Red, Green, and Blue. This diagram explains the swapping, which allows us to 'see' infrared as if it were a normal color:
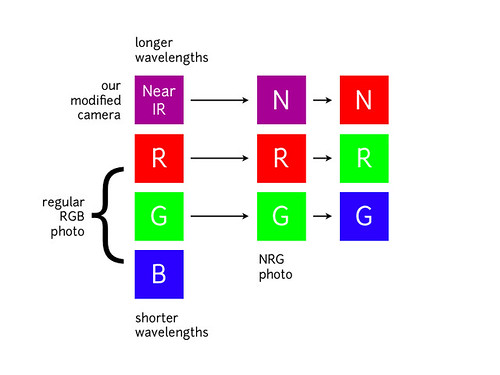
In NRG images, the deeper and clearer the red color, the denser and healthier the vegetation (more or less).

Figure above: Normal color photo (top) and normalized difference vegetation index (NDVI) image. NDVI image was derived from two color channels in a single photo taken with a camera modified with a special infrared filter. Note that tree trunks, brown grass, and rocks have very low NDVI values because they are not photosynthetic. Healthy plants typically have NDVI values between 0.1 and 0.9.


other examples of DIY NDVI imaging from around the internet:
Begin watching at 2 minutes to see the resulting imagery:
This topic is part of the Grassroots Mapping Curriculum series.