NDVI stands for "Normalized Difference Vegetation Index". NRG stands for "Near-infrared / Red / Green". NDVI and NRG are both ways to visualize the amounts of infrared and other wavelengths of light reflected from vegetation. Because both these methods compare ratios of blue and red light absorbed versus green and IR light reflected, they can be used to evaluate the health of vegetation. It's a snapshot of how much photosynthesis is happening. This is helpful in assessing vegetative health or stress. (Read more here: https://www.agronomy.org/publications/jeq/articles/36/3/832) ## Do-It-Yourself These techniques for vegetation analysis were developed for satellite imagery, but at Public Lab, we've been working a lot on capturing infrared imagery using our DIY [near-infrared camera](/wiki/near-infrared-camera) setup, and combining it with visible bands to produce NDVI images such as the one above. ## What these images mean What exactly are these images we're trying to make? What do they tell us about vegetation, and why? These diagrams should help to understand what it is we're doing and why these are good ways to analyze plant life. ## The NDVI equation [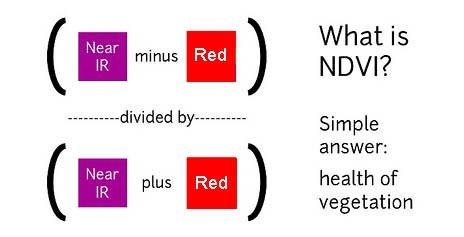](/i/44723) **NDVI = (Near Infrared - Red)/(Near Infrared + Red)** NDVI is a ratio which tries to emphasize photosynthesis while filtering out sun glare. The above equation is run for every pixel, using source data from an infrared photo and a visible light photo, like this pair: [](https://publiclab.org/system/images/photos/000/021/771/original/5390895115_c9d4d38fec_o.jpg) The result can be false-colored to make the high-photosynthesis areas more clear, and used to examine where plants are and how healthy they are. [](https://publiclab.org/system/images/photos/000/021/770/original/PetVISNDVIcomp.png) _Figure above: Normal color photo (right) and normalized difference vegetation index (NDVI) image (left). NDVI image was derived from two color channels in a single photo taken with a camera modified with a special infrared filter. Note that tree trunks, brown grass, and rocks have very low NDVI values because they are not photosynthetic. Healthy plants typically have NDVI values between 0.1 and 0.9. -- @cfastie_ ### Activities Here are a range of activities you can do to produce and interpret your own NDVI imagery, whether downloaded from a satellite imagery provider or [collected yourself using a DIY technique](/wiki/multispectral-imaging) [activities:ndvi] ****   Most DIY converted cameras today (those from Public Lab) use RGN instead of NRG, so the blue channel represents infrared instead of the red channel. That looks like this: [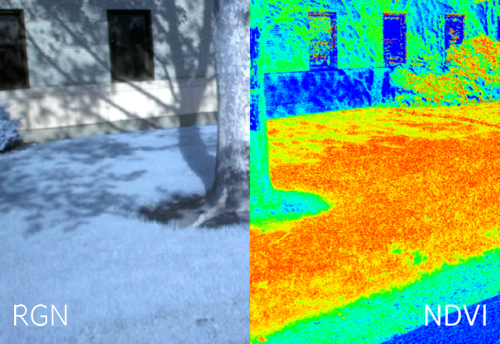](/i/45468?s=o) **** ## NRG imagery Some people are also interested in producing NRG imagery (like the below image), where `Near-Infrared, Red, and Green` are used to compose a picture instead of the usual `Red, Green, and Blue`. [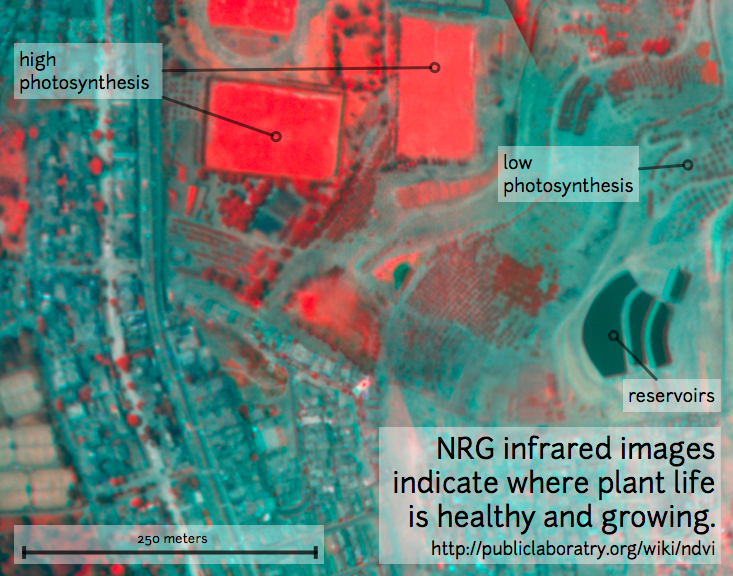](/i/25064) This diagram explains the swapping, which allows us to 'see' infrared as if it were a normal color: [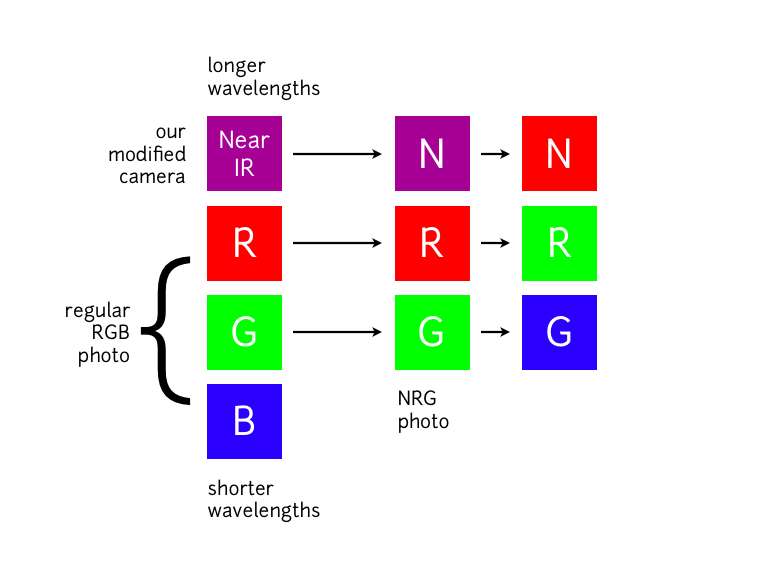](/i/25063) **In NRG images, the deeper and clearer the red color, the denser and healthier the vegetation (more or less).** ### Questions [questions:ndvi] ### Other examples of DIY NDVI imaging From around the internet: Begin watching at 2 minutes to see the resulting imagery: *This topic is part of the [Grassroots Mapping Curriculum](/wiki/mapping-curriculum) series.* **** [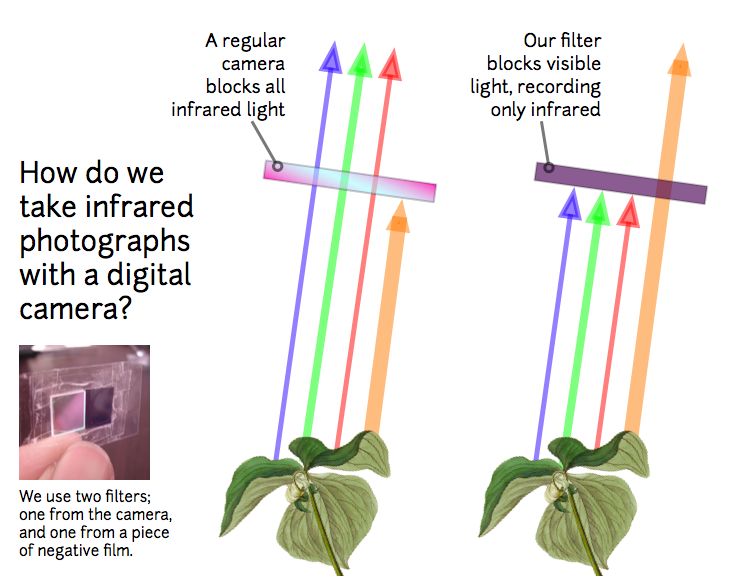](/i/25066) [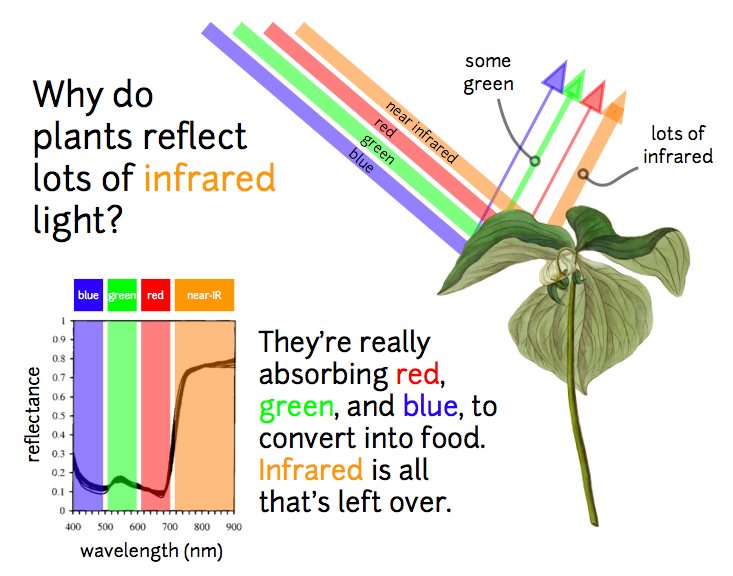](/i/25065) ...
| Author | Comment | Last activity | Moderation | ||
|---|---|---|---|---|---|
| warren | " Hi! This is awesome. Have you seen our Infragram Pi software, somewhat documented at: https://publiclab.org/infragram-pi https://publiclab.org/p..." | Read more » | about 5 years ago | |||
| Bronwen | " This is fantastic! Looking forward to seeing your conclusions! " | Read more » | about 5 years ago | |||
| bansal_sidharth2996 | " Hi, please submit your proposal on the GSOC official website at the earliest. Thanks " | Read more » | about 5 years ago | |||
| warren | "@warren awards a barnstar to imvec for their awesome contribution! " | Read more » | about 5 years ago | |||
| bansal_sidharth2996 | " I really like your proposal Few suggestions We are looking forwards for supportive folks. Make sure to do 1. at least one PR review each week and..." | Read more » | over 5 years ago | |||
| warren | "Also, I wonder if the inverted values are due to your using a blue not red filter? I believe the ndvi equation needs to be reversed too if you do t..." | Read more » | over 5 years ago | |||
| warren | " Oh that's super, we'd love to see it. Thanks! " | Read more » | over 5 years ago | |||
| petter_mansson1 | "At the moment I have only the code on private repository. I will conduct an experiment where I try to look for changes in NDVI values corresponding..." | Read more » | over 5 years ago | |||
| warren | " Hi! Very cool! I'm curious if you've posted your code anywhere, I'd love to see it! " | Read more » | over 5 years ago | |||
| petter_mansson1 | "EDIT: Did some further testing and it was an error on my end. Used the wrong module to colormap the pictures. Ill leave the rest of the comment tho..." | Read more » | over 5 years ago | |||
| kumarvirendran | " This is one the best blog for health. we are here give health-related best information. Those give you better health solution, which can be helpfu..." | Read more » | over 5 years ago | |||
| nedhorning | " I can think of two possible reason. The most obvious would be that the illumination changed and the other is that the sensor temperature change. S..." | Read more » | over 5 years ago | |||
| Corymbia | "Thank you both, I really appreciate your help. My tiles were far from perfect, but from next week on I will be able to test with six Spectralon sa..." | Read more » | over 5 years ago | |||
| cfastie | "Subtracting the blue channel from the red channel is a good first step for correcting for contamination of the red channel with NIR. With one parti..." | Read more » | over 5 years ago | |||
| nedhorning | "It's good you discovered that. Yesterday I started to write about the need to subtract the blue band (NIR) from the red band (red + NIR) so you get..." | Read more » | over 5 years ago | |||
| Corymbia | "Hi, I have some trouble previewing my processed DNG images in Matlab, but the channel values are similar to the ones in your image. Since the red c..." | Read more » | over 5 years ago | |||
| nedhorning | "I used this following dcraw command: dcraw -D -W -4 Image1.ORF to create this image which has been scaled to 16-bit integers: https://drive.googl..." | Read more » | over 5 years ago | |||
| nedhorning | " I have to run out now but will try to make time to check this in the morning. It's also possible it's due to the nature of the filter and after ca..." | Read more » | over 5 years ago | |||
| Corymbia | "Sure, I've just uploaded ORF files for all three images to the google drive (link at the end of my post). Unfortunately I couldn't find any inform..." | Read more » | over 5 years ago | |||
| nedhorning | "Can you post one of your RAW images? I looked at Image1.dng and that shows the Bayer pattern so it needs to go through a debayer process to create ..." | Read more » | over 5 years ago | |||
| Corymbia | "How do you make sure the white balancing step is omitted? I tried that myself (see table 3 and figure 5 in my note), but the resulting NDVI values ..." | Read more » | over 5 years ago | |||
| nedhorning | "I use RAW pixel values for calibration analysis and since white balance doesn't impact RAW values I don't usually worry about it. If you want to us..." | Read more » | over 5 years ago | |||
| Corymbia | "Thanks, I will try! One more problem I noticed yesterday was that (at least when I set the white balance on a red/white surface) the red channel g..." | Read more » | over 5 years ago | |||
| nedhorning | "The calibration coefficients are, in the simplest case, the slope and y-intercept of the linear regression line for wavelength (based on calibratio..." | Read more » | over 5 years ago |