Hello PublicLab community!
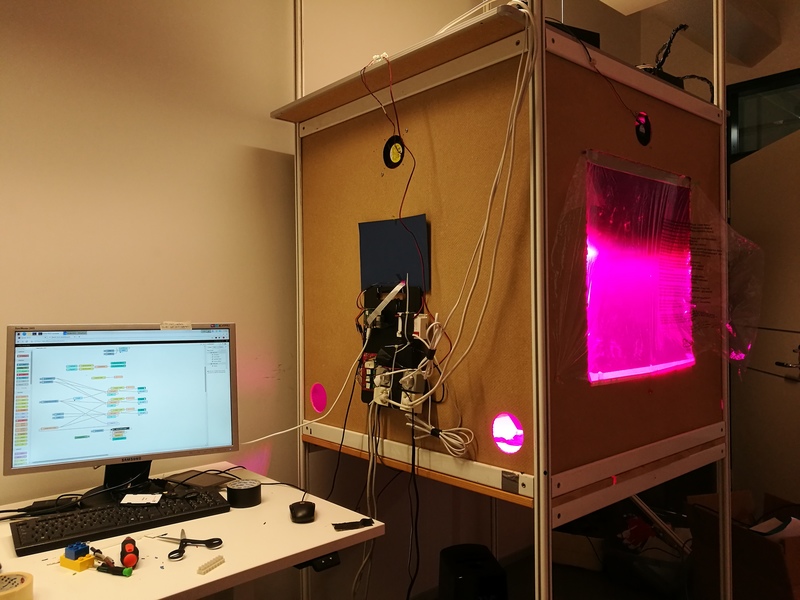
I'm currently working on a relatively large dataset which I recently produced for my master's thesis, and I'm having some issues with processing the data and interpreting the results. The experiment was conducted using a self-made, rudimentary growth chamber-setup built around a Raspberry Pi model 4 and Node-Red (Fig. 1). The system involved sensors and actuators for environmental humidity & temperature control, artificial LED-lighting with three controllable wavelengths (blue, red, NIR) and a RPi NoIR v2. camera system with a red filter. The aim of this project was to find out how NDVI values correspond to drought stress in plants, which could be helpful in developing automated stress detection systems for e.g. indoor farming systems. The experiment was replicated three times to ensure better statistical significance.

Figure 1. Growth chamber with connected peripherals.
Illumination & filtering
The LED-panel had three channels which could be independently switched on or off by the RPi: blue (452nm), red (637nm) and NIR (843nm). I do not have data on the absolute light intensities of these channels, but their measured peak wavelengths are displayed in the figure below. Two "illumination modes" were programmed into the system: 1. "grow mode", in which red and blue were used for promoting photosynthesis and 2. "image capture mode", in which red and NIR were used to provide sufficient light for NDVI image capture. The camera module was RPi NoIR v.2 and the filter was a Rosco Primary Red #106, which transmits wavelengths longer than 580nm and seems to have similar characteristics as some other red filters mentioned here in PublicLab.

Camera settings & image calibration
I adjusted the camera WB and exposure settings using petter_mansson1 's GUI script method (https://publiclab.org/notes/petter_mansson1/04-09-2019/low-cost-ndvi-analysis-using-raspberrypi-and-pinoir). Unfortunately, I seem to have lost the original python script files which included the exact custom gain settings, but if I recall correctly, the setting for the blue channel was higher than for the red channel. The camera settings remained the same during the entire experiment. Nevertheless, I still managed to get decent images to calculate the NDVI.
I calibrated the captured images using nedhorning 's ImageJ/Fiji calibration plugin (https://publiclab.org/notes/nedhorning/07-22-2015/introducing-the-calibration-plugin-for-imagej-fiji). For calibration, I used a piece of white printing paper, a red office filing folder and a board painted with matte black paint. These may not be the best options, but were the most easily accessible items at the time.
Data
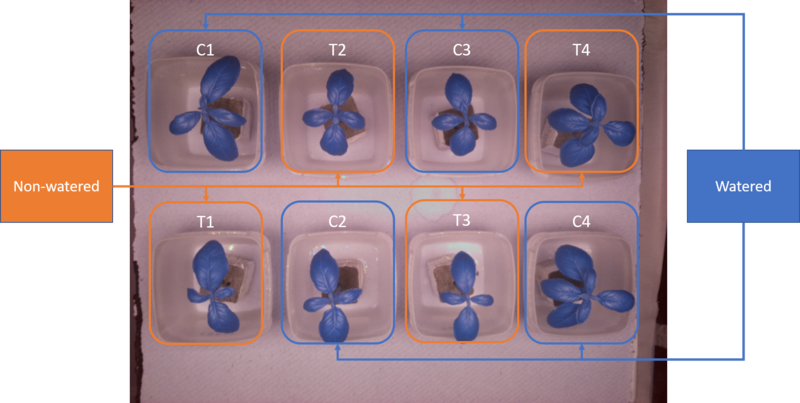
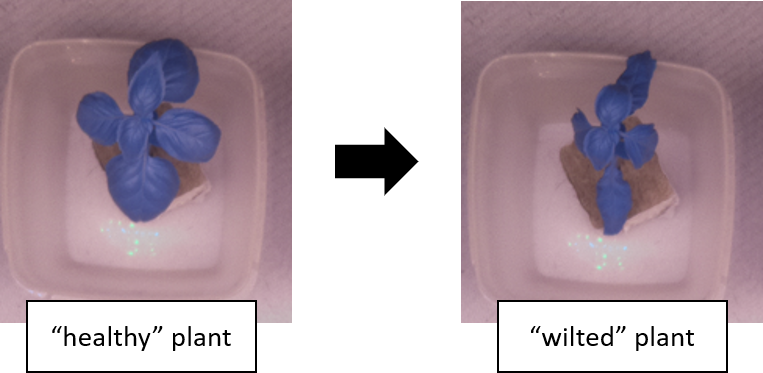
The raw dataset consists of image sequences of young sweet basil (O. basilicum) plants (fig. 2) with two treatments: plants which were regularly watered (C1, C2, C3, C4) and plants which were only watered once (T1, T2, T3, T4) in the beginning of the experiment. Images were captured continuously during day and night at three hour intervals until the non-watered plants had all wilted. The "wilting timepoint" for each non-watered plant was determined as the point in time which the leafs clearly drooped down, which to my interpretation translates to a drop in turgor pressure in the plants (see fig. 3). This visual attribute represented a "human-eye" reference point in the data.
The images were segmented and processed into NDVI pixel intensity histograms using ImageJ macros and the photomonitoring plugins developed by nedhorning. Based on the extracted data, various parameters for each plant were calculated, such as average NDVI and rough estimations on leaf area based on pixel count.

Figure 2. Each replication of the experiment had 8 basil plant cuttings, which had been rooted in rockwool cubes. Four plants (C1, C2, C3, C4) were watered and the remaining four (T1, T2, T3, T4) were not. Plants were arranged in the same fashion in every replication.

Figure 3. Position of leafs indicating the "wilting point" for a non-watered plant.
Different wilting timepoints
The non-watered plants wilted at slightly different timepoints in all replications, which was the first challenge to overcome when interpreting the data. To get another perspective on the data during statistical analysis, I marked the wilting point of each of the non-watered plants and created a sort of reversed timeline which counted down to the wilting point in hours. As a result, the datapoints were organized in such a way that the emphasis was on the changes in the NDVI values before the wilting point for each plant.
 Timelapse
animation of a sequence of 52 processed NDVI-images from the first replication of the experiment. Leaf "waving" motion is most likely a result of
a natural day-night cycle of the plants. Note the different wilting timepoints
of the plants. LUT: 16colors.
Counter-intuitive NDVI-values
While the system itself performed well enough to allow for reliable image capture and replication, some weird and rather counter-intuitive patterns emerged from the data. For example, in the first replication of the experiment the non-watered plants seemed to have higher NDVI values on average than the watered control plants (fig. 4). However, these differences were not statistically significant until wilting point. A similar trend appeared in the other two replications as well. Shouldn't it be the opposite?

_
Figure 4. Processed images and corresponding average NDVI values extracted from histogram data displayed in a box-and-whisker plot from the first replication of the experiment. X-axis represents the time until wilting point in three-hour intervals. (Note: for clearer visualisation, the plants in this figure are in different order than in figure 2.)
Why are drought-stressed plants expressing higher NDVI values?
Here are some thoughts I came up with.
1 Changes in photosynthetical reactions:
I have not yet had the time to dig into the literature regarding e.g. the biochemical aspects of this phenomenon and have not come up with an explanation for this.
2 Illumination gradients:
Could inconsistent lighting conditions in the scene influence the plant tissue absorptance/reflectance properties captured by the camera and thus somehow skew the resulting NDVI values?
3 Narrow-bandwidth vs. broad spectrum lighting:
The illumination source used in this project was a custom-made LED-panel. The only wavelenghts during image capture were red (637nm) and NIR (843nm) with very narrow SPDs. The blue light (452nm) was switched off because of possible leakage to other channels in the IMX219 sensor. Maybe the narrow bandwidths of the LEDs don't provide "enough" information regarding the stress levels? Or the peak wavelenghts were "off the mark"?
4 Filter type (red/blue):
Could red and blue filters have differences in their ability to detect drought stress, specifically?
5 Image post-processing:
Some image enhancements e.g. histogram stretching, vignetting or exposure corrections could be done in the raw data, but at the moment have not been implemented.
...
p.s. Unfortunately, the setup in which this experiment was conducted has already been disassembled, so any further replications with the same hardware may not be done.
I would like to thank everyone who have contributed to developing these NDVI-imaging solutions in the PublicLab community. The information I have found on this site has been absolutely essential in progressing my master's thesis. I figured it was time to reach out to the community to share my work and gather some thoughts and ideas to help me finish the project._
_
That time lapse animation is an excellent data visualization. This makes it clear that your setup was able to control some important variables. The circadian rhythm which you apparently captured is fascinating.
You are asking the question Why did the non-watered plants have higher NDVI than watered plants? But your results confirmed that there were no statistically significant differences between those two treatments. So your experiment revealed that the NDVI of the non-watered plants was NOT higher than that of the watered plants.
It is probably not too surprising that NDVI did not reveal water stress before the plants wilted. A well-known feature of plant stress is that it does not quickly impact the spectral reflectivity of foliage in a way that would be captured by NDVI. One reason healthy foliage reflects less red than NIR is that chlorophyl absorbs more red than NIR. When a leaf wilts, the chlorophyl is still there and continues to absorb red (that’s what pigments do). A leaf severed from its branch can appear to be green for days because its chlorophyl will continue to absorb red light. It can be days or weeks after plant stress starts before that stress can be detected with NDVI. This has been demonstrated for agricultural crops and other vegetation types. Later, when the chlorophyl degrades, it will not absorb as much red and NDVI measures will respond. Also, as the cellular structure of the leaf changes the originally high reflectivity of NIR will diminish and NDVI values will drop.
There might be an explanation for the non-significant difference between the two treatments, but the difference is so slight that it could be due to many causes unrelated to the objective of your study. Searching for the cause might be unproductive because there are a few features of your setup that could produce artifacts.
A. Calibration or custom white balance? These are two separate techniques to adjust the brightness values (DNs) in the red and NIR channels so they can be proxies for the energy reflected from foliage. Only one of these techniques is required, although it appears that you tried to do both. It might have been better to capture RAW image files (no white balance adjustment) and adjust the DNs with a calibration procedure. I don’t know what your calibration procedure was, but it should have included spectral reflectance characterization of your three target materials at 647 nm and 843 nm. It should also have included an estimate of how much the red channel was contaminated with NIR light. Good values for these parameters are required for calibration.
B. How much NIR does the camera capture? There are three variables impacting how much NIR the camera can record.
Relative intensity of LEDs. It would help to know the relative intensity of the LED illumination at 647 nm vs. 843 nm. When photos are taken, is most of the light red?
Spectral sensitivity of the camera. From the graph you include, we know the camera is less sensitive to NIR than to red light.
NIR transmission of Rosco filter at 843nm. You correctly depict the transmission of the Rosco filter in the NIR region with a dashed line. I have never seen data on the NIR transmission of Rosco filters, so it appears that you don’t know how much of the 843 nm NIR passes through the Rosco filter and reaches the camera sensor. The filter could be blocking a large portion of the 843 nm NIR light.
Although plants in nature are bathed in about the same intensity of NIR as red light and healthy foliage reflects maybe three times more NIR than red, the amount of reflected NIR your camera was capturing might have been just a fraction of the reflected red it was capturing. Another factor which will reduce the ratio of NIR:red is the contamination of the red channel with NIR. This inflates the measure of red light.
The calibration procedure could compensate for this diminished NIR:red ratio, and it is important that it be done correctly.
It seems that your results are in agreement with previous research. NDVI is generally not expected to reveal water stress before plants wilt. With all the variables that must be controlled in such an experiment it is an important accomplishment to get the result you did.
Chris
Is this a question? Click here to post it to the Questions page.
Reply to this comment...
Log in to comment
thank you for the reply @cfastie
Your reasoning regarding the chlorophyll's performance under water stress sounds reasonable. "It seems that your results are in agreement with previous research. NDVI is generally not expected to reveal water stress before plants wilt." Could you possibly point me to some literature regarding this? I find it interesting that the values appeared to be higher (although not significantly) in the stressed plants, and I probably have to try to describe it somehow in the discussion. __ In hindsight, I suppose a more suitable stress treatment which clearly disrupts the chlorophyll machinery, e.g. salt stress or nutrient deficiency/surplus would've revealed the differences better, and in a more "expected" manner.
***EDIT: something just clicked in my head and I think I now understand what you meant with capturing RAW-images and not using white balance adjustment. At the time these images were captured I wasn't aware that the RPi camera module was capable of handling RAW images ...
The peak wavelenghts were measured using two separate spectrometers, because the other wasn't able to record in the VIS spectrum, and the other in the NIR, respectively. I have the files in csv-format, but I'm not sure if they include the relative intensity of the measured channels. Is it somehow possible to calculate the intensity?
One confession about the rosco-transmission graph which I forgot to mention: values represented with the dashed line (above 740nm) are indeed an estimate of the transmission, and the true transmission can be anything. I will reconsider using these estimates in the final version, as they are not really valid.
Is this a question? Click here to post it to the Questions page.
Reply to this comment...
Log in to comment
While messing about with the data, I came up with some other ways to approach the situation. Based on the pixel count of the "vegetative tissue" I derived the leaf area in cm2 for each plant using the measuring tools in ImageJ. A similar boxplot-graph as before was produced, but still no statistically significant values were present until 6 hours before wilting.
Then, by creating an index which included the leaf area and the previous average NDVI for each plant, I produced yet another graph. This approach did actually yield some statistically significant differences already at 30 hours before the wilting point.
This is based purely on my experimentation with the data, and I'm not sure whether I can use it in my thesis. I haven't come across with any similar approaches in the literature.
In determining the significance values I used a T-test with two-tailed distribution and assuming equal variances.
Is this a question? Click here to post it to the Questions page.
Reply to this comment...
Log in to comment
A lag between plant stress and NDVI response is commonly reported in the remote sensing literature: https://www.google.com/search?q=ndvi+stress+lag
I don' t know why this type of stress would be different from water stress.
The key to calibration is knowing the reflectivity of your targets at the wavelengths used to compute NDVI (647nm, 843nm). I don't know if your method allowed you to know this.
Using different spectrometers prevents you from knowing the relative intensity of the two light sources (unless there was overlap between the two sources and it was captured by both spectrometers).
You still have the filter so you can still measure its NIR transmission.
You can use the result in your thesis if you can demonstrate that artifacts emerging from the combination of:
produce a conservative method of determining a difference between your treatments (i.e, a method not likely to show a difference when one is not there).
Otherwise it would be a classic case of P-hacking.
Chris
Is this a question? Click here to post it to the Questions page.
"Otherwise it would be a classic case of P-hacking." - I was thinking something along these lines as well. This is something I definitely wish to avoid.
Reply to this comment...
Log in to comment