Quick roundup of new features and improvements:
SpectralWorkbench.org
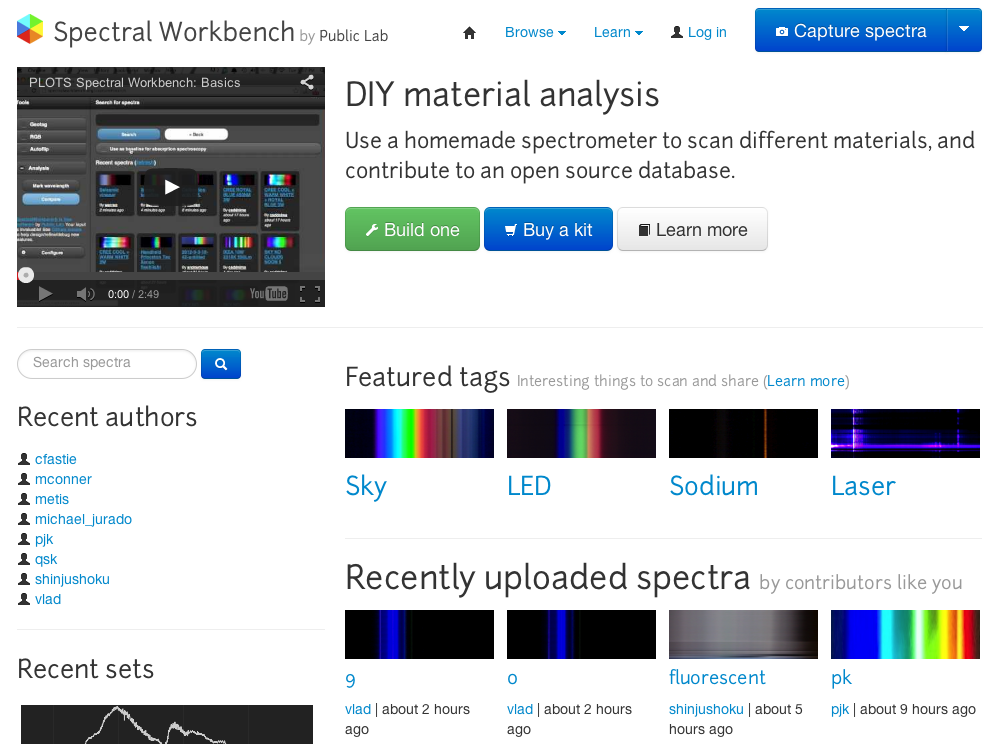
Changes to SpectralWorkbench have been varied; a really obvious one is on the front page (which you must be logged out to see), pictured above -- we are now showing 4 "featured" tags for different interesting things to scan, to encourage people to try things beyond the basics, and give folks an idea of what things should look like.
A blitz of wiki page edits has also resulted in new pages for:
- Spectrometry activities
- Spectrometry sampling guide including tips for water, oil, and flame spectrometry
- A "flare spectroscopy activity" simulating gas refinery flare monitoring, but doable in a classroom, using a candle and a spray bottle of salt water.
These pages are now better-represented on the dashboard:

A new stats page shows some exciting stats about contributions: 1600+ contributors and over 10k spectra!

PublicLab.org
A slew of changes have hit PublicLab.org too -- one nice one is that user profile pages now list wiki page contributions, and also display a graph of research note posting over the past 52 weeks:

The improved Stats page also shows such graphs for the whole community:

There are also stats available on contributor pages (linked to from the tag pages) for contributors who've posted content with the given tag. See how "infragram" post have grown since the launch of that project:

Lots of other small improvements abound but these are some of the more exciting & fun ones. Thanks to Bryan and Dogi, and to all of you for sticking with us as these sites progress! Special thanks to those who've documented bugs on Github, as well.
8 Comments
hi, i wanna ask you about how to get the spectrum value, but not in RGB. can you help me?
Is this a question? Click here to post it to the Questions page.
Reply to this comment...
Log in to comment
There should be an averaged # in the JSON, CSV, and XML downloads, but since the camera records it in RGB, perhaps the best way is to just add R+B+G?
Is this a question? Click here to post it to the Questions page.
Reply to this comment...
Log in to comment
But that average is from RGB right? I want to know about value of the intensity from the spectrum. How you get that intensity? I think that's not from value of average or RGB.
Is this a question? Click here to post it to the Questions page.
Reply to this comment...
Log in to comment
Cameras only record intensity for R,G, and B channels, separately -- the Bayer filter prevents raw, full-bandwith intensity reading. :-/ Sorry!
Reply to this comment...
Log in to comment
Sorry, i want to ask you again. In the spectrum there is % y-axis, what does it mean? can i get the value of % y-axis with different wavelength?
Is this a question? Click here to post it to the Questions page.
Reply to this comment...
Log in to comment
Ah, i see what you're asking. OK:
Ideally, we would measure all wavelengths equally in each pixel -- the diffraction grating should be separating out the colors (wavelengths) and each pixel records a different one, from 0-100% of the sensor's ability to detect light. (not an absolute measurement).
However, since the camera has R, G, and B filters on each pixel, we instead get three images, each of which is filtering for a region of the spectrum. We could try to use data only from the "best" band -- like, measure green light generally with the green sensors, and red with the red. But what about light that's partway between green and red? (yellow) Where do we decide where to switch sensors? It probably varies per camera, too. So at this point, for consistency, we just add all three channels together. This is not as good as a monochrome (full spectrum) sensor, but those just aren't available at the low price and high resolution of webcams.
Does that help?
Is this a question? Click here to post it to the Questions page.
Reply to this comment...
Log in to comment
Oh Iunderstand now, thank you.
As I know, the range of RGB is 0-255 but in spectrum I see that max value of red is 257, why?
And how about the correlation between wavelength and RGB? How you get the value of wavelength?
Thanks
Is this a question? Click here to post it to the Questions page.
Reply to this comment...
Log in to comment
ah... i think there may be a slight bug in the digitization of the image. Perhaps it was multiple rounding errors? Apologies... i could look it up in the code if that's helpful?
The wavelength value is the x-position of the pixel, since the light has been split by wavelength.
Is this a question? Click here to post it to the Questions page.
Reply to this comment...
Log in to comment
Login to comment.