Particulate Matter (PM) is a primary contributor to air pollution, and a major component of the Air Quality Index. Of the different sizes of PM, PM 2.5 (particles 2.5 microns or smaller) is the most harmful to human health. According to the EPA: "Exposure to fine particle pollution can cause premature death and harmful cardiovascular effects such as heart attacks and strokes, and is linked to a variety of other significant health problems. Particle pollution also harms public welfare, including causing haze in cities..." (EPA 2012). PM 2.5 is primarily produced through combustion, but can also form in chemical reactions in the atmosphere via industrial emissions, or indoors through the burning of candles, cooking, or smoking. See Public Lab's wiki on PM for more info.
The EPA standards for PM 2.5 are 12 μg/m3 annually, and 35 μg/m3 over a 24-hour period. That means, the EPA considers it unsafe for certain groups to be active when PM 2.5 concentrations exceed those standards. PM concentration is measured in units of μg/m3, which is the mass of the PM in a given volume. If you picture an amount of dust in the air, and ball that up in your hands and weigh it, it would likely weigh less than a gram. 1 μg is 0.000001 grams, and if you take that 1 μg of that dust and visualize it in a volume of air, in this case 1 m3 of air, you have 1 μg/m3.
Finding PM concentrations on either side of the standards is not an on-off switch for safety, however. A Harvard study found that "for every 10 μg/m3 increase in short-term PM2.5 exposure, there was a 2.8% increase in mortality" (Kloog et al. 2013). It's bad to breathe PM 2.5, and even worse to breathe it for an extended period of time. It's because of this, and because the St James region is already disproportionately burdened by air pollution, that we chose to monitor PM 2.5 among other pollutants. The Game Over Formosa Plastics team has successfully deployed three Purple Air monitors in the St James region. One in Vacherie, one in St James, and one in Welcome. See the project page for a link to view the monitors. We have been monitoring the data over the last month, and are presenting data from the three monitors here.
Table 1. Summary of Data from Three Public Lab Air Monitors
| Site | # of Days | Average PM 2.5 (μg/m^3) | Maximum PM 2.5 (μg/m^3) | Amount of Time over 12 μg/m^3 (hrs) | |
|---|---|---|---|---|---|
| Vacherie | 32 | 5.5 | 196.73 | 102.67 | |
| |
|
|
|
|
|
| St James | 32 | 3.93 | 35.86 | 62.83 | |
| |
|
|
|
|
|
| Welcome | 32 | 2.83 | 73.18 | 42.5 | |
As seen in the table, the average PM 2.5 at all three sites over a 32-day period was less than 12 μg/m3. However, a significant amount of cumulative time at each site had concentrations above 12 μg/m3 - 4.3 days at Vacherie, 2.6 days at St James, and 1.8 days at Welcome. Additionally, the maximum concentrations at each site were extremely concerning. The reading of 196.73 μg/m3 at Vacherie is considered "Very Unhealthy" by the EPA Air Quality Index. At concentrations this high, the recommendation is for "people with heart or lung disease, older adults, children, and people of lower socioeconomic status should avoid all physical activity outdoors. Everyone else should avoid prolonged or heavy exertion" (EPA 2018).
Figure 1. PM 2.5 at Vacherie from 3/23/2022 to 4/25/2022

Figure 2. PM 2.5 at St James from 3/23/2022 to 4/25/2022
Figure 3. PM 2.5 at Welcome from 3/23/2022 to 4/25/2022

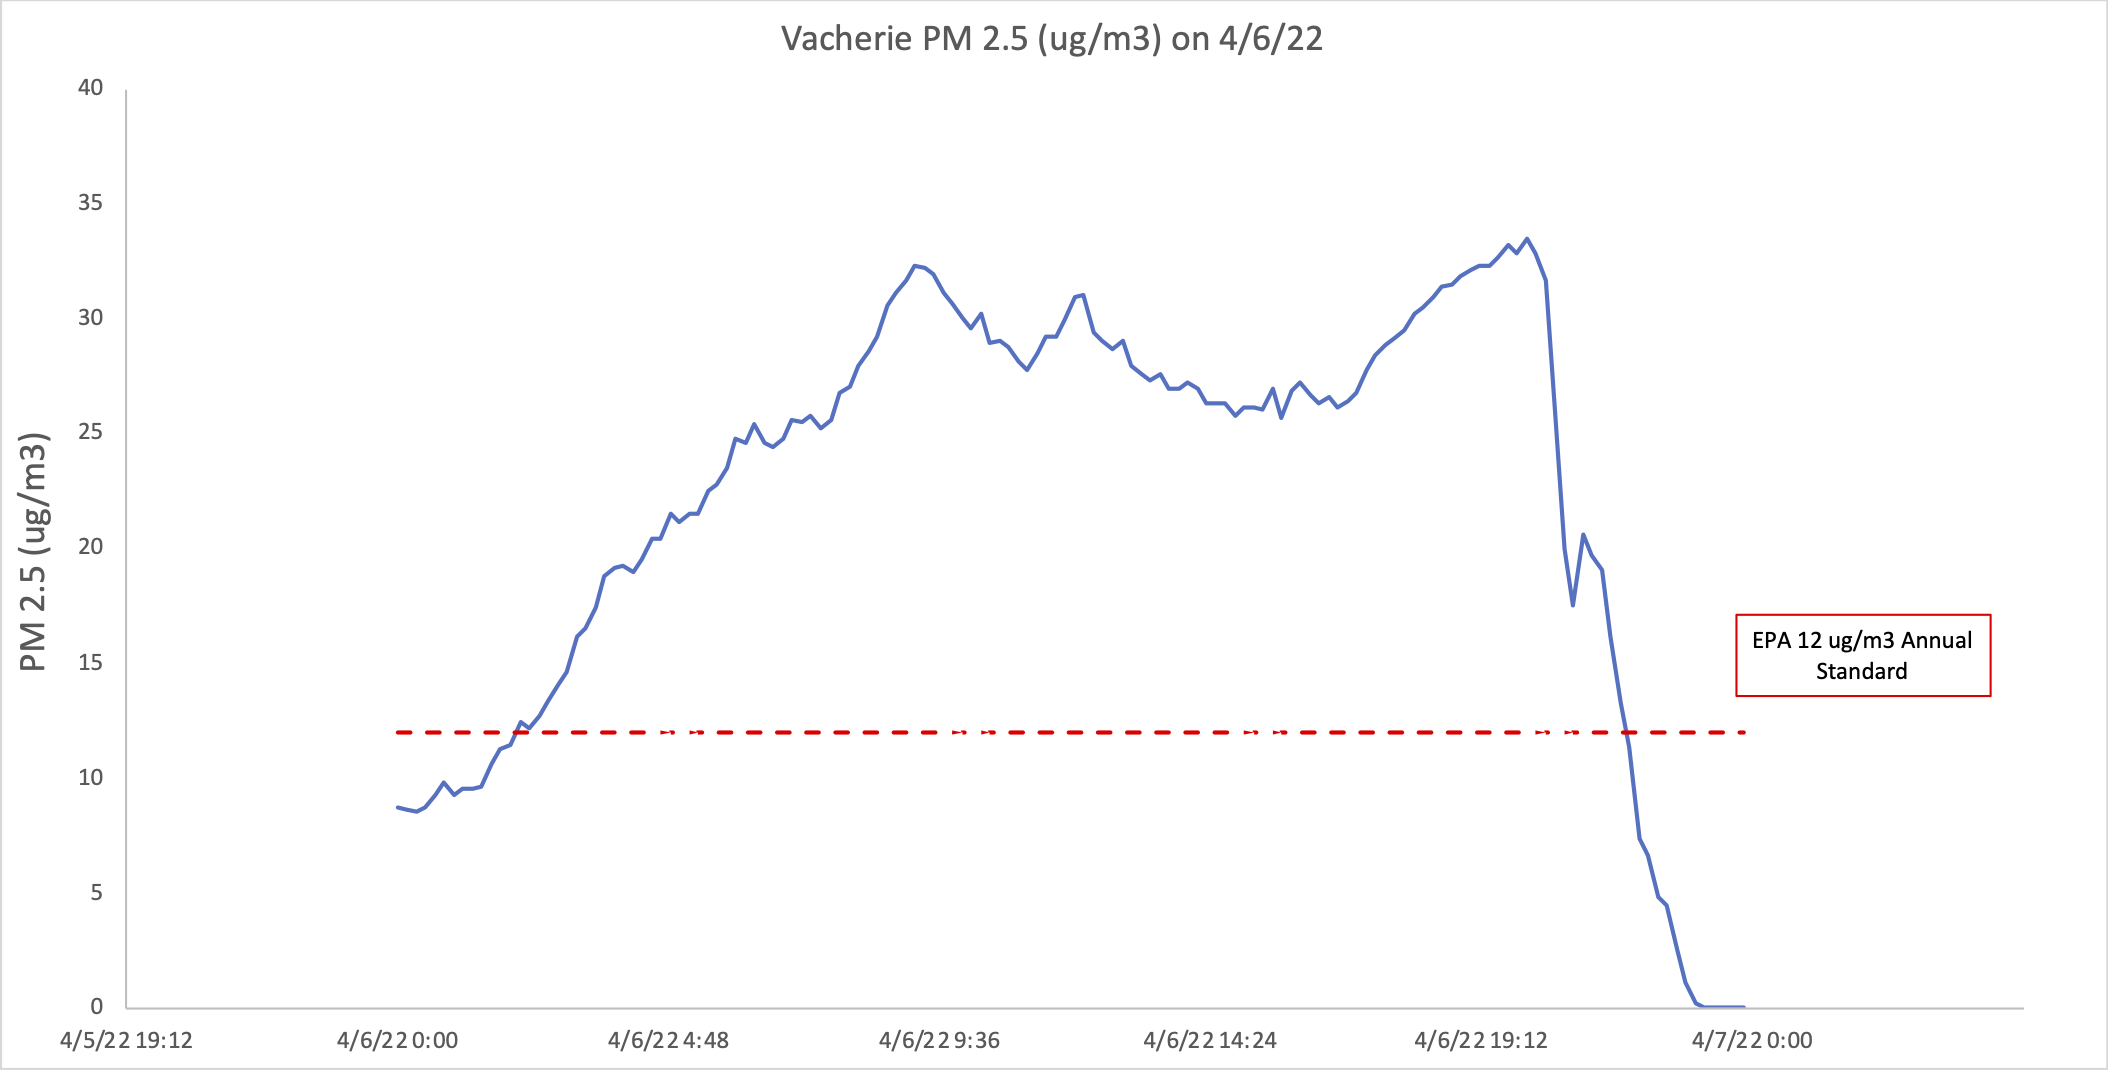
Several high PM 2.5 events were noticed as well, particularly on April 6th, with PM 2.5 rising above 12 μg/m3 for over 19 consecutive hours at all three sites (Figures 1-3). Spikes in PM 2.5 can be commonly observed from diesel trucks or other mobile and temporary sources of pollution, but when multiple monitors at different locations all record the same rising concentrations, something else is happening. On this particular day, foul odors and large flares were noticed coming from the American Styrenics facility (see previous Project Update for more background).
In the coming months we hope to find trends in the high PM 2.5 events to help our investigations, and will continue to monitor the results to understand the background pollution levels in the region.
0 Comments
Login to comment.