
Hi All, newbie here. In another context I've been thinking about what the color channels for NIR filtered consumer-grade color cameras mean. Someone directed me to the PublicLaboratory NYC site, and I've started playing around with ir image at Liz Barry's 8-3-2011 note, from which I ripped the color image and nir image.
As a teaser for the nerd-talk in the rest of this note, above is a very false color image I made purely by monkeying with the NIR image. Note that in addition to the plume visible in the original NIR and composite image, there there seems to be a sequence of regularly-spaced interesting red spots close the shoreline above and to the left of the plume--closer to the shoreline than the posts or buoys or whatever they are. I say "seems" because I've taken some mathematical liberties that I am pretty sure will amplify noise and image compression artifacts and that I haven't kept careful track of. On the other hand, much of the color detail in tracks nicely with features and material differences in the visible and NIR, so I'm hopeful.
Next is my thinking out loud piece. There is a lot of information about color response on this site that I have not yet digested, so if I say something ignorant please direct me to the relevant source. In the(my)lack of detailed information about the camera used and the way it was setup, I used whatever information I could find, and hope that it applies.
1) the ccd arrays used in standard digital cameras have a quite a large spectral sensitivity in the near IR.
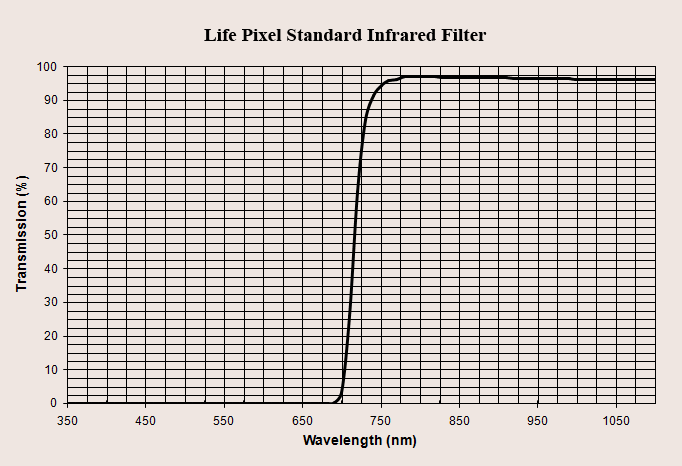
2) A good IR filter conversion for digital cameras such as the standard filter at life pixel have a very flat response down to below 1100nm.
3) On the other hand, the response of the Bayer array color filters (p3 of this) on a RGB ccd array are 1) almost identical below about 800nm, but 2) in the nearest NIR between 720 and 800nm there is a significant difference in response between the R and GB channels, and much smaller but perhaps still useful response between the G and B. This means that at each pixel in a NIR filtered camera the three color channels have a common baseline due to illumination in the 800-1100nm range, plus a differential spectral response to illumination in the 700-800nm band. This to say that there is spectral information in those RGB channels that can be utilized.
What I did (in increasing level of mathematical sophistication): A) For each color channel I computed the mean intensity over the whole image. (I used the mathematica software package-for which I have a license through my daytime job-for all of this, but a lot if not all could be done in ImageJ, and a decent programmer--i.e. not me--could make a plugin. I'd be willing to help) B) subtract the mean from each channel, and compute the covariance matrix of the (all 7,990,272) three dimensional vectors of pixel RGB values. If you're interested, this happens to be (0.101457, 0.0731181, 0.109591 0.0731181, 0.0562355,0.0779212 0.109591, 0.0779212, 0.119208) C)"whiten" the data by multiplying by the inverse symmetric square root of the covariance matrix times each RGB vector. This has the effect of amplifying slight variations in tint in the NIR image to get a more robust color map. An unwanted possible side effect is that it might also amplify noise and image compression artifacts to extent that they could be confused with features in the image--though if this is happening with this image it isn't apparent to me.
5 Comments
Cool - so you stretched intensity variation over a full color spectrum? I wonder what those shoreline red dots are, too...
Is this a question? Click here to post it to the Questions page.
Reply to this comment...
Log in to comment
Very interesting. I confused the water and land due to the land being blue and the water being green. I had to look at the original image to find that out. A color table closer to expectations would have helped. It is still an impressive image.
Reply to this comment...
Log in to comment
Hi Tom, This is amazing. Your method has brought out so much detail in the image! To get even more feedback, consider posting to the plots-infrared list -- https://groups.google.com/group/plots-infrared Also I wanted to invite you to a meetup focusing on infrared imaging that we are doing with FarmHack http://farmhack.net/forums/ifarm-imaging-agricultural-research-and-management-field-day-0. It is for Saturday May 18th at noon, in Lee, NH, and i will likely be traveling up there from NYC in some fashion.
Reply to this comment...
Log in to comment
Warren, as I understand you, no. What I am doing is magnifying the intensity variation between the different color bands in the image as presented, to squeeze out the information about response to different parts of the 700-800nm band. I'll modify my post to try to explain this better sometime in the next few days.
Dan, the good thing and the bad thing about me is that I am a numbers guy, so I have only an intuitive notion of what you mean by color table. Can you link me to an explanation? Besides, the little water we have out here often looks green. :c)
Off to work...
Is this a question? Click here to post it to the Questions page.
Reply to this comment...
Log in to comment
I don't have a link for you. Your intuition is probably fine.
Reply to this comment...
Log in to comment
Login to comment.