Background Since writing some notes, a while back, on improving dynamic range ( HDR: In search of High-er Dynamic Range ) and ( In Search of Spectrometer Attenuators ) two nagging issues have remained.
1) How to avoid adding out-board attenuation to gain more data and 2) How to eliminate, or at least reduce, the difficulty of setting the intensity just below clipping for RGB channel data.
I think I've now found a simple approach to both problems and I believe this could be implemented in Spectral WorkBench. Maybe as a Gsoc project?
Dramatic Benefit

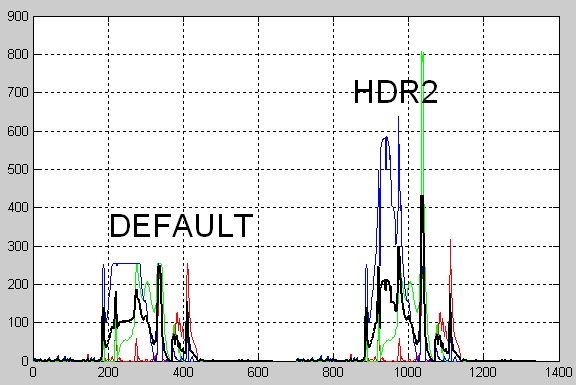
Notice the clear improvement in detail by extracting more information from the full spectral band image.
The (BLUE) plot data is compressed by the clipping
The (BLACK) HDR2 plot clearly shows the additional detail which SWB presently throws away.
Notice that the HDR2 algorithm does not alter the non-clipped data so there is no added error for weaker signal data.
Comparison Below is a sample result; extracted from a 'typical' CFL spectrum using the PLabs hardware approach (although I just captured the whole 640x480 image).

Notice the following
The LEFT plot shows the typical RGB+Grey (Grey = the expected output spectral response) with both the Blue and Green channels clipped.
The RIGHT plot shows the (now extracted) missing data for those clipped regions.
The LEFT plot shows that the RGB data is 8-bit limited (0-255 range) but the RIGHT plot has no such limit.
Clipping now works to advantage instead of something to entirely avoid.
If the original spectral image has been retained, then the additional data can still be extracted to update older spectral plots.
Yes, the calculated values will have some error but I believe that error is small relative to the improvement in a) small signal detail and b) clipping compensation.
Yes, this graph was generated from some hackware in matlab to test the theory so the algorithm could likely be improved.
Yes, clearly there are limits to how much over-exposure can be allowed and still trust the calculated fill-in for the clipped data.
I'm guessing that this technique could be incorporated into SWB code.
Ok, so how's it done? Below is what many think of as the spectrum band from their PLab Spectrometer as they watch and adjust in Spectral WorkBench. That band is created as a time-sequence of a single line of pixel data as it is captured over and over. It is a nice tool for making sure the data.
 NO, Not this spectral 'band'.
[ Note: The present approach has the user identify the position of a horizontal line through the center of the spectra and display the R, G, B and combined Grey spectrum result. Then the user must try to adjust the light to prevent any of the R/G/B curves from clipping as that causes errors in the final spectral response curve. The weakness of this approach is that it is hard to do and it throws away a huge amount of data which can be leveraged in software. ]
However, that is not the 'spectral band' I'm referring to. I'm talking about the 'band' of color as it appears in the original camera frame image.
Consider a 'typical' CFL spectra from the PL camera (640x480 pixels) 8-bit image:

Instead, imagine collecting not just one 'line' of pixels, but ALL of the pixel lines within the displayed spectrum. Notice that the spectra is generally bright in the center and fades above and below. This is because the system (slit, CD and lens) attenuate the signal -- so use this 'built-in' attenuation to perform an 'HDR' type function.
[ Note: I experimented with "stepped-width" slits which can help a little but that approach suffers from 1) variable resolution and 2) being ineffective because (my conjecture) the camera optics are poor. However, those experiments opened the door to other possibilities. Instead of attempting to control the light intensity as detected by the CCD camera, just extract more data and apply a bit more software processing. This is where the 'stepped-slit' might help a little, but note that the above spectrum image and plot did not use a special stepped-slit.]

For example, consider the intensity profile of just one 'vertical' line of green pixel data in a bright green band. It will be 'weak' at either end ('top' and 'bottom') and 'strong' in the middle where it can easily be too bright and 'clip' the green signal data. Before, clipping was a bad thing, now, it is necessary so as to bring 'up' the weaker signals out of the noise; thus improving dynamic range.
[ Note: Here, for simplicity, we must make an assumption: Whatever the profile of the attenuation toward the top or bottom of the displayed spectrum, the camera CCD data is linear. Yes, DSLRs, with high bit-depth, have a non-linear curve applied to the sensor's linear data which extracts more contrast out of the dark regions and presents a better match to the human visual system which is non-linear. So, this is an area for further exploration to improve accuracy. ]
Intensity Profile Below is the averaged RGB intensity profiles which graphically describes the attenuation, from top to bottom, of the spectral band. The 'peak' of this curve is the center 'bright-spot'; typical location chosen for generating the SWB plots.

Now you can see the importance of generating this profile. Since the intensity data is linear, then even if the signal does 'clip' at it's brightest point, it will not clip when attenuated (at that same wavelength). That attenuation profile can be extracted by reading data from the entire spectral image band. This profile can then be used to calculated what the signal intensity must be even though the measured data (when clipped) cannot display it. That correction is used to 're-write' the original RGB data in the 'clipped' regions and the corrected RGB data is then used to generate a new final spectrum plot which has improved dynamic range.
So, what's the algorithm?
Auto-locate the spectrum within the image area
Average successive 3-line block of spectrum pixels
Extract linear-only intensity data from all averaged lines
Use only the linear results (64-128)(yes, arbitrary) data values
Average and Identify the peak intensity pixel line
Perform ordering (max-to-min) array of linear intensities
Re-scan the 'peak' trace and identify any R,G,B clipping
Correct the clipped regions using the nearby line intensity ratios
Plot the corrected R,G,B plus re-calc the 'Grey' final spectrum
Yes, the above algorithm is a bit 'brute-force' and could likely be improved but it works well enough for proof of concept as a starting point.
Finally, as with any research, there is the potential for missing issues and details so I welcome observations and comments.
Cheers, Dave
4 Comments
Dave,
This is an excellent idea. It looks like you are able to get much more information out of typical spectra. A quick look at recent spectra at SWB suggests that many of the images do not have attenuation at the top and bottom (but maybe they are cropped?). I wonder if it would work to have a gradient filter in the spectrometer so any image had variable intensity from top to bottom. Do you think a continuously varying slit width (from top to bottom) would work? Maybe not if you had problems with the stepped slit, and that would also vary the resolution. Nice concept. Chris
Is this a question? Click here to post it to the Questions page.
Reply to this comment...
Log in to comment
Chris, I suspect there is more attenuation gradient to be gleaned from the images than first meets the eye (as there was more than I'd suspected in the one sample I picked). That said, yes, I think some optimization of the slit is possible and could easily enhance this effect. I build some stepped-slits (about 0.4" long and 6 steps from 8-20 mils). The theory was 3-dB steps but in practice (laser-photo-printed) were not so well defined. However, I think there is room for improvement. -Dave
Reply to this comment...
Log in to comment
Chris, I just looked around at some of the posted spectra and I think I see the source of the issue you raised. The posted spectra images are NOT from full frame images, they are of a single line of pixels which are displayed as a time-series; top-to-bottom. True, that time series will NOT work as it is NOT a real spectrum. To get the full data I reference, you need to capture the full frame (or a sequence of frames and average them) and extract the spectral 'band' out of that frame. Any single-line pixel 'spectrum', even if in a time-series, is throwing away too much information. -Dave
Reply to this comment...
Log in to comment
Hi Dave, I know you made this post quite a while ago. Have you done any other exploration in HDR? I am trying to include it in an app that would automatically calculate the HDR profile (using, for example 3 images at known and different shutter speeds).
This method you proposed is very simple and very cool, especially since you only need one image. I think the drawback would be that maybe not all spectrometers have a consistent attenuation effect around the edges, and that the data may not be as accurate in the higher extrapolated intensities.
I was thinking instead to control the shutter speed? (Predefined exposures can be programmed for Raspberry pi, although it might be more difficult to achieve in other webcams. There is an equation already implemented in matlab here (http://www.pauldebevec.com/Research/HDR/debevec-siggraph97.pdf) and here (https://www.csie.ntu.edu.tw/~cyy/courses/vfx/07spring/lectures/handouts/lec02_hdr.pdf) describing how you can generate a sensor response curve based on a series of images. This would produce very repeatable results, but is harder to implement in software! If you had any experience with this I'd love to know.
Is this a question? Click here to post it to the Questions page.
Reply to this comment...
Log in to comment
Login to comment.