Overview
Available as a Google Doc here.
Time: 90 minutes
Materials: Whiteboard & markers (or alternative collaborative note-taking space) #babylegs #microsplastics trawls samples (sorted and dried), dissecting scope or Community Microscope, student computers (with access to statistical software like Excel, CODAP, Google Sheets or a USB port), a glass or plastic petri dish, tweezers, sewing needle & source of heat (i.e. lighter), nail polish remover, blank plastics data sheet
Further Reading
- The Community Microscope from Public Lab
- Plastics in the Gut by Max Liboiron
- How to Help Students Develop Digital Literacy from Edutopia
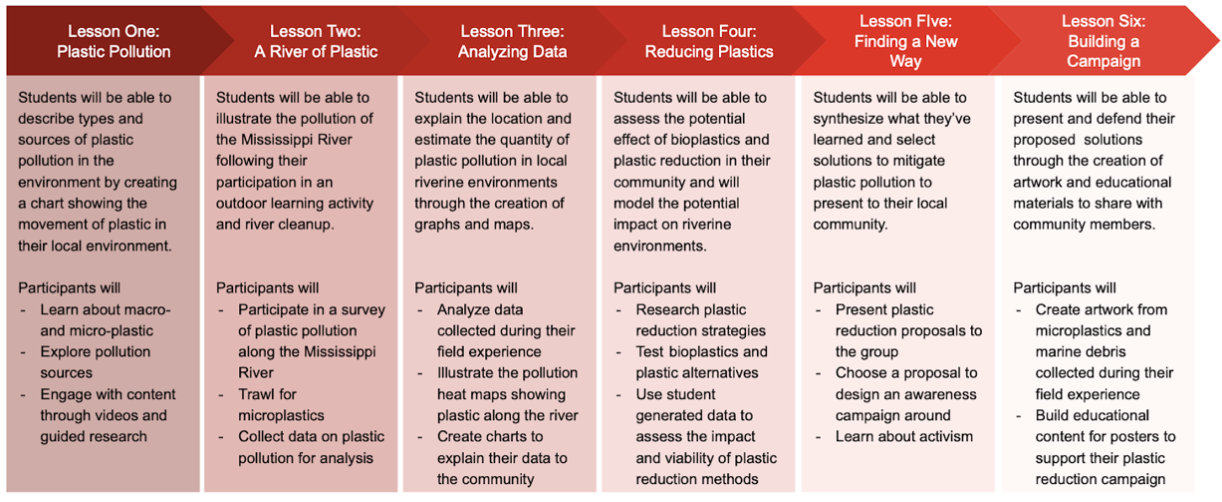
Objective: Students will be able to explain the location and estimate the quantity of plastic pollution in local riverine environments through the creation of graphs and maps. They will do this through analyzing data collected during their field experience, illustrating the pollution using heat maps showing plastic along the river and creating charts to explain their data to the community.
Preparation Prior to Lesson
Process the babylegs aquative samples. Instructions here.
Split students into small groups of 3-5 students per sample.
Print copies of the plastic analysis data sheet.
Optional: Print copies of the Community Microscope build instructions for students.
Engage
Time: 25 minutes
Review the objective for today's lesson with students. Student discuss and answer the following questions:
- How do we tell plastics from non-plastics?
- What can we learn from this data?
- In what ways might you communicate this information to interested parties?
Next, have students build their dissection scopes. These will be built out of easy-to-access parts, like webcams and LED lights. Using the parts from the Community Microscope into kit, students will foollow these instructions to build a simple dissection scope. To use the scope, students will need access to a computer with a USB port.
Optional: show students this video, explaining in more detail the Community Microscope's history, development and use.
Explore
Time: 55 minutes
Process Babylegs Samples (25 min)
Using the microscope students have just built (or pre-made dissecting scopes), students will perform a forensic analysis of their babylegs samples, using these instructions as a guide. Students should be encouraged to read through the guide and ask questions before beginning their analysis. Students can use this identification guide to help with the identification of common microplastics. Students should record their data in the plastics analysis data sheet, either on paper or online through a collaborative platform, such as google sheets (this will make data sharing much simpler).
Data Analysis (30 min)
At this point students should have data on:
1. Types and abundance of microplastics (from babylegs samples)
2. Abundance of Nurdles on teh shores at the site (from NurdlePatrol protocol)
3. Types, abundance, and location of microplastic pollution (from Marine Debris Tracker protocol)
Working in three groups defined by the types of data above, students should decide how to analyze their data and how to communicate it visually through a graph or chart.
For those who need a refresher, here is a worksheet explaining some statistical analysis methods and what they can tell us.
For resources on creating graphs and charts, check out the links below:
-What are heat maps and how to create them in Google Sheets
-Making and using box plots to determine outliers
-How to make a line chart in Google Sheets
-Using bar graphs in Google Sheets
Evaluate
Time: 10 minutes
Synthesize and Share
Have students write up a summary of what they've found to share with the class. Students should be sure to explain their findings using the graphs ro charts created, and explain what these numbers mean in the real world (i.e. environmental impacts).
0 Comments
Login to comment.