About Me
Name : Mridul Nagpal
Github : https://github.com/mridulnagpal
LinkedIn: https://www.linkedin.com/in/mridul-nagpal-0663bb131/
Affiliation : International Institute of Information Technology, Hyderabad - 500032
Location: Hyderabad, India
Email: mridulnagpal07@gmail.com
Project Title: Leaflet Blurred Location
Gitter: mridulnagpal
Project description
The project I will be doing this summer will be :-
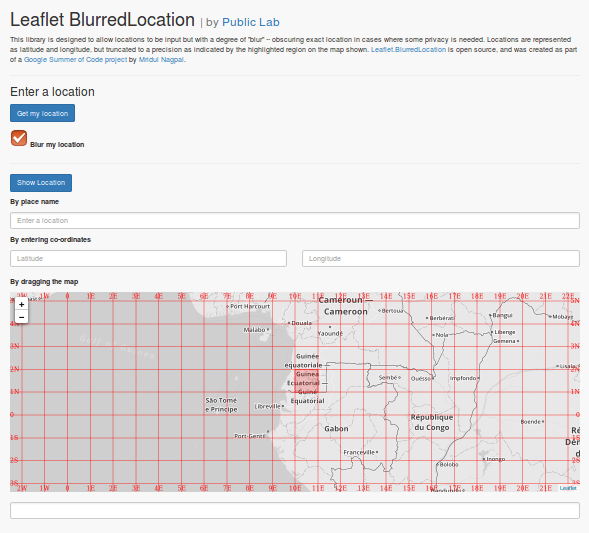
Leaflet Blurred Location:
This summer we will be enhancing the present Leaflet Blurred Location library. We will first be adding a Display library name Leaflet Blurred Location Display (already exists with basic functioning https://publiclab.org/notes/warren/02-28-2017/call-for-proposals). We can also start connecting people on the basis of the location they enter. We can switch to other geolocation API to make it faster. Option to subscribe to specific locations as well linked with email notifications. Some brief summary points are as follows:
1. Connect people on the basis of location they enter.
2. Change geolocation API
3. Subscription to specific regions (with email notifications)
4. Add information about projects to maps like title, # of contributors, etc.
Detailed features:
1. Connect people on the basis of their location they enter - We will have some bins on the basis of precision the user enters and will have a database for all the projects happening, whenever a user enter his lat-lng using leaflet blurred location, we will cross check with our database and either create a bin or add the user to an existing bin depending on the precision, then if there are any updates on any project in that bin, we notify all the people belonging to that bin. We can also add an option to connect among other people in that region(bin), not only projects.
2. Change geolocation API - Change our currently used google geolocation API to https://www.npmjs.com/package/node-geocoder or some other API, and explore any extra features it might provide us.
3. Subscription to specific regions - Even if a user is not in a region/bin, he/she can subscribe to that region/bin and will be added to that bin and treated like all other people in that bin.
4. Add information about projects to maps - This will include adding information about any project inside a region/bin, this information will help in creating emails to be sent to the users subscribed to the bin, thus helping them understand more about the project.
About existing leaflet blurred location:
The library already exists with many functionalities and we will be adding to those functionalities. There is a live demo for leaflet blurred location hosted live from the gh-pages branch of the github repo. I will be making changes to that repo and maintain a constant demo for all the things I implement in the library. The current live demo is hosted at https://publiclab.github.io/leaflet-blurred-location/examples/ . All the visual changes can be seen on the demo page and all the backend functionalities can be checked using the console. The existing repo for leaflet blurred location is present at https://github.com/publiclab/leaflet-blurred-location. The basic functioning of the existing library can be seen in the documentation present in the repo as well.
Issues to be resolved (Already existing):
- https://github.com/publiclab/plots2/issues/2254
- https://github.com/publiclab/plots2/issues/1934
- https://github.com/publiclab/leaflet-blurred-location/issues/84
- https://github.com/publiclab/leaflet-blurred-location/issues/116
- https://github.com/publiclab/leaflet-blurred-location/issues/119
- https://github.com/publiclab/plots2/issues/141
Timeline/milestones:
I will use Agile Development Methodology for this project. Given below is a rough timeline for my project, subject to change by mentor intervention:
- Community Bonding period (24 April - 14 May): I will go through the source code of PublicLab.leaflet-blurred-location( https://github.com/publiclab/leaflet-blurred-location) and improve my approach for this project.
- Week 1 (15 May - 22 May): Creating the threshold where a our blurred location starts being a point. And testing the code written using Jasmine (This will be done in the leaflet-blurred-location-display library).
- Week 2 (23 May - 30 May): Rendering a default display on each tag page, like https://publiclab.org/tag/stormwater or https://publiclab.org/tag/air-quality. (This will be done in the main plots2 repo).
- Week 3 (31 June - 6 June): Starting with the area-based subscription, creating test mails for subscribers as we do so.(Also to be done in the main repo or create a new repo separately just for this).
- Week 4 (7 June - 14 June): Continuing with area-based subscription adding Q & A feature of what you are subscribed to.
Phase 1 evaluation
- Week 5 (16 June - 23 June): Buffer time for testing and polishing of work done till now.
- Week 6 (24 June - 1 July): Prompts to add other profile tags (roles, affinities, interests) on profile, for (on profile page) what equipment you have and are willing to show up with to a group field event, for (on profile page) what equipment you have and are willing to loan out.
- Week 7 (2 July - 9 July): Continuing with prompts and testing each one while implementing them .
- Week 8 (10 July - 17 July): Making new Leaflet layers on Publiclab.org maps (SkyTruth Alerts, the Toxic Release Inventory: https://publiclab.org/q/15653).
Phase 2 evaluation
- Week 9 (18 July - 25 July): Adding 2 more layers to Publiclb.org maps (WaterReporter.org (uses GeoJSON), MapKnitter maps (publiclab/mapknitter#251))
- Week 10 (26 July - 2 Aug): Adding tests for all the layers added above and integrating with main repo.
- Week 11 (3 Aug - 10 Aug): Buffer Time.
Final term Evaluation are submitted to Google
Structure for Power Tagging using geolocation:

Needs:
All the resources I will be requiring are on the internet such as PublicLab.Editor, Jasmine documentation, leaflet documentation, etc. And I would of course require the guidance of my mentor.
Setup:
I have built and tested all 3 repos involved in my project and have forks of all three.
Fork: https://github.com/mridulnagpal/plots2
Experience:
I have experience with Django, Ruby on Rails, Javascript, C++, HTML, CSS. I have been working on this project for approximately a month now.
Here are some of my PR's:
- https://github.com/publiclab/plots2/pull/1310
- https://github.com/publiclab/plots2/pull/1257
- https://github.com/publiclab/plots2/pull/1223
- https://github.com/publiclab/plots2/pull/1279
- https://github.com/publiclab/plots2/pull/1202
- https://github.com/publiclab/plots2/pull/1171
- https://github.com/publiclab/plots2/pull/1149
- https://github.com/publiclab/plots2/pull/1131
And some more...
Teamwork:
I have been part of National Graphics Competition and scored a grade A for a project which included 3 members. I find it easy to mix up with people and am comfortable to work in a team. I also have been building a web project for my college with my team.
Passion:
Being in college under the load of assignment I do not get much time to think about the better of the world. Therefore I think this would be the best platform for me to atleast do something for the greater good rather than my own. I also have keen interest in web development and this project will let me enhance my skills.
Audience:
I would try my level best to make whole of my project well documented and easy for users to interact with. I will make sure that LocationTags using maps will be easy to interact with.
Commitment:
I understand that this project is equivalent to a full time summer job and will work on it according the timeline I have mentioned above.
26 Comments
@warren Can you add some things to this as well?
Is this a question? Click here to post it to the Questions page.
Reply to this comment...
Log in to comment
I will -- i haven't opened up the call for proposals on Summer of Code but I definitely will in a week or two. Thanks, Mridul! Do see some of the thoughts I put down here:
https://publiclab.org/wiki/gsoc-ideas#Interactive+Project+Maps
:-)
Reply to this comment...
Log in to comment
Good to hear from you, by the way!!!
Reply to this comment...
Log in to comment
:D
Reply to this comment...
Log in to comment
@warren I looked at the projects you posted and added some features as well, can you review the features? Thanks :)
Is this a question? Click here to post it to the Questions page.
Reply to this comment...
Log in to comment
This is great -- @liz, what other geographic features might we add to this proposal?
Is this a question? Click here to post it to the Questions page.
Reply to this comment...
Log in to comment
Maybe start looking through https://github.com/publiclab/plots2/milestone/7 and https://github.com/publiclab/plots2/issues/1416 too!
Reply to this comment...
Log in to comment
Can you also link a bit more to the Leaflet Blurred Location project and demo? Thanks!
Is this a question? Click here to post it to the Questions page.
Reply to this comment...
Log in to comment
And of course this odd bug... a tough one! https://github.com/publiclab/plots2/issues/2186#issuecomment-365715578
Reply to this comment...
Log in to comment
@warren I added information about leaflet blurred location and links as well. Also the nation problem will be resolved once we change the google API, which is there in the proposal. Also most of the other issues resolve through power tagging of maps which will be done as well. What more things can we add to this proposal?
Is this a question? Click here to post it to the Questions page.
Reply to this comment...
Log in to comment
Hi @mridulnagpal , i have this doubt that this feature : https://publiclab.org/wiki/gsoc-ideas#Interactive+Project+Maps , do we have to include in leaflet-blurred library OR do we have to make an API of near-by projects and show the markers on normal leaflet-maps and then generate an alternative-view .
The only confusion i am having is that do we have to implement these features in plot2 directly (as written in idea description) OR in leaflet-blurred-library .
Thanks so much for helping :) :) .
Reply to this comment...
Log in to comment
@sagarpreet We will have to modify both, as changing the geolocation APIs, making it more user friendly, marker security, etc. these will be done in the library itself. And the subscription and emails will be done using existing API for leaflet blurred location, integrating it to plots. @warren what do you think about it? Glad I could be of help :)
Is this a question? Click here to post it to the Questions page.
Reply to this comment...
Log in to comment
Hi @mridulnagpal , can you explain (maybe in the proposal itself) as to why we should change the current Google Geocoding API ? What more features can we get if we use any other API ? Thanks !
Is this a question? Click here to post it to the Questions page.
Reply to this comment...
Log in to comment
The geocoding is now fixed -- thanks!
I think a lot of this project has to do with integrating Leaflet Blurred Location with plots2 -- so, for example:
Plenty left also in the main planning issue here: https://github.com/publiclab/plots2/issues/1416
I also love:
And think we could break this up more finely -- say:
12 projects near youor45 people within ~100 milestype information on plots2And I also love the location-based subscriptions which are kind of related to the above number 2. -- maybe we need
Node.near(lat, lon, dist)andUser.near(lat, lon, dist)to achieve this? Cool!Hey, great work here! Lots more to do and if others want to work on this project too, there seems to be plenty of work to go around! Say, if @sagarpreet wanted to take a few of these, for example, or start at the "other end" and meet in the middle. Collaboration is great! :-)
Is this a question? Click here to post it to the Questions page.
Reply to this comment...
Log in to comment
Oh, and also, could you post a screenshot (as lead image) of the current interface popup on PublicLab.org? It looks so great, let's show it off! :-)
Is this a question? Click here to post it to the Questions page.
Reply to this comment...
Log in to comment
Hi @warren and @mridulnagpal !
I would really love to work with @mridulnagpal .
I am ready to work on any feature which @mridulnagpal finds suitable .
Agreed :) -Collaboration is great!
Reply to this comment...
Log in to comment
@sagarpreet Sounds awesome. @warren Adding all the issues you specified to the project plan. Anything else we can add? Also do you mean the leaflet-blurred-location interface for the screenshot? Thanks!!
Is this a question? Click here to post it to the Questions page.
Reply to this comment...
Log in to comment
Hello @mridulnagpal,
@warren told me to coordinate with you, regarding the geographic APIs we are discussing in this proposal, for a team up. I also proposed to make a v2 API in my proposal. So I think it would be great if in v2 we can also add your project, and for that we need to work together, which will be fun.
Whenever you are ready, let's begin this thing. You can visit to my proposal here: https://publiclab.org/notes/Raounak/02-21-2018/gsoc-proposal-v2-api-development
Thanks
Reply to this comment...
Log in to comment
@Raounak Sounds awesome, its like building a team. Really happy with the co-ordination this time. @warren We can extend the feature list even more if more people are willing to work on leaflet-blurred-location.
Reply to this comment...
Log in to comment
Awesome @mridulnagpal , so what we should do now? Do we need to make a common proposal? And how should we decide on features?
I think it will be great to make a slack channel for this? What you think? @warren @mridulnagpal , please share you point on this
Is this a question? Click here to post it to the Questions page.
Reply to this comment...
Log in to comment
I think it's fine to have separate proposals with complimentary features, and it's OK if they overlap a bit, or are listed more than once!
Take a look over here too! https://github.com/publiclab/leaflet-blurred-location-display/issues/9
Factoring lots of these systems into the API will also be relevant, as has already been started on for some of the map views: @Raounak @rishabh07 @sukhbir
Thanks, all!
Reply to this comment...
Log in to comment
@warren I have added a timeline, please let me know if I missed something, or if anything needs to be changed.
Reply to this comment...
Log in to comment
Hi Mridul I liked your proposal a lot. Can you also add how can we invite new contributors through your Soc Project as per the outreach plan?? Thanks
Is this a question? Click here to post it to the Questions page.
Reply to this comment...
Log in to comment
@bansal_sidharth2996 Creating the new library Leaflet blurred location display , we can have new-comers-issues in both the repos as we did last year. And once they get the taste of these libraries they can continue to join plots2 repo as well. I can create some issues with steps to solve them as well. Something like this https://github.com/publiclab/leaflet-blurred-location/issues/9.
Reply to this comment...
Log in to comment
@warren Added some things to the proposal, please have a look.
Reply to this comment...
Log in to comment
This is looking super. Thanks a lot, @mridulnagpal! Best of luck!
Reply to this comment...
Log in to comment
Login to comment.