
Purpose
I recently attended a session of Greenpeace's Data Activist Co-op where Marena Brinkhurst from Mapbox gave a great technical tutorial of their free Sheet Mapper tool. Sheet Mapper is a data visualization tool that takes data points in a spreadsheet format and displays them on a web map. Once set up, the map will update as more data is added to the spreadsheet. This is a relatively simple data visualization technique useful for any location-based information such as points of odor complaints, sites for soil testing, locations of community resources, etc.
These steps will help quickly turn data in a spreadsheet into an interactive map conveying points of interest and their corresponding data.
The session followed this set of instructions--"Coop Activity Instructions" ---to create an Activist ATLAS to connect people and projects from across the world. (Feel free to add your name, location, expertise, and what you're interested in learning to this "geospatial rolodex" linked in the instructions linked above!) Though I'm paraphrasing for simplicity's sake, check out the full instructions for more info or troubleshooting. All credit goes to Marena from Mapbox and Greenpeace!
Note: You must have latitude and longitude coordinates for each data point. But fear not! Marena also shared a super easy resource for geocoding (finding the latitude and longitude corresponding to a location/address) linked below.
Open-source tools used
- Sheet Mapper from Mapbox
- Nominatim (for geocoding)
- Google Sheets
- GitHub (for hosting your web map)
Step 1: Create free accounts for...
- Mapbox
- Google Drive (so you can make a google sheet)
- GitHub
Step 2: Get your spreadsheet ready
You must have geospatial data (or data tied to a specific location) in a Google Sheet to utilize this tool.
- Open an Excel or CSV file in Google Sheets by going to File>Import>Upload
Set sharing settings to 'Anyone with the link can view'
- Click green 'Share' box in top right corner>Click 'Change to anyone with the link'
Sharing settings should appear like below
Click 'Done' to save

Step 3: Get your data ready
Make sure your spreadsheet has fields (or columns) for "Latitude" and "Longitude"
- To make things simpler, avoid spaces in all your column headings
Get latitude and longitude for data point locations
Marena used Nominatim, an open and free resource for geocoding
Search an address in the search bar
Click 'Details'>Copy coordinates listed in "Centre Point" row>Paste into your spreadsheet in corresponding "Latitude" and "Longitude" columns
Note: I had some trouble with Nominatim---it has no forgiveness for typos and does not return addresses in unincorporated parts of cities. I got around the second issue by only using the street address and county and/or state (omitting city). If anyone has another resource for geocoding please share!
Step 4: Create useable link to your spreadsheet
- Use this link as a template: https://docs.google.com/spreadsheets/d/{key}/gviz/tq?tqx=out:csv&sheet={sheetname}
- Replace {key} with your Google Sheet ID and {sheet_name} with the name of your sheet.
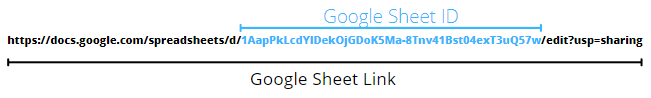
To find your Google Sheet ID:
In Google Sheets, click green 'Share' button in top right corner>'Copy link' on pop-up box>Paste link into notepad or scratch document
Find Google Sheet ID within link (ID will begin after 'spreadsheets/d/' and end before '/edit')
To find the name of your sheet:
This is the name of the tab on Google Sheets holding your data
By default, the name is Sheet1 but can be renamed to anything. (Again, avoid using spaces in sheet names just like column headings.)
Here is an example of a ready-to-go link to a sample spreadsheet with a sheet named "Data":
https://docs.google.com/spreadsheets/d/1AapPkLcdYlDekOjGDoK5Ma-8Tnv41Bst04exT3uQ57w/gviz/tq?tqx=out:csv&sheet=Data
Note: omit brackets in template above
Step 5: Set up your web map code
- Open any text editor and create a file called "index.html"
- Note: For Windows, a common text editor is Notepad++. For Macs, Text Edit. Any program that produces .txt file format will work.
- Paste Mapbox's demo code available on GitHub into your new "index.html" file
- Add your Mapbox access token to demo code
- Open Mapbox and sign in
- Scroll to Access tokens and click "+ Create a token"
- Name your project and click "Create token"
- Note: See this link from Mapbox for more info about restricting access to certain URLs for added protection
- Back in your text editor, find "YOUR TURN: add your Mapbox token" (around Row 94) and replace the highlighted portion below with your personal access token from Mapbox
- Add a basemap style
- Mapbox has several different base maps to choose from or you can design your own. Choose a Mapbox-designed map style and copy its Style URL
- A few lines below your access token, you'll find a place to input your chosen Mapbox Style URL:
- Connect your spreadsheet to your web map code
- Replace the highlighted portion of your web map code below with your link from the end of Step 4.
- Existing demo code:
- Updated code with my spreadsheet link:
- Add columns from your spreadsheet to pop-up when users click a location on your web map
- Find "//You can adjust the values of the popup to match the headers of your CSV" in the demo code.
- Replace 'Address' and 'Phone' with columns from your spreadsheet you want to display.
- I changed mine to match my spreadsheet columns "CityName" and "Population"


Step 6: Host your web map with GitHub
Note: I've copied this portion of the tutorial almost exactly from Greenpeace's "Coop Activity Instructions" google doc which pulls heavily from Mapbox's Sheet Mapper Education Lab. This begins at Greenpeace's Step 8 under the heading "Hosting your web map with GitHub."
- Create a new GitHub Repository
- Open GitHub
- Select 'Create a new repository'
- Name it for your map project (this will be visible in the URL)
- Make the repository 'Public'
- Under "Initialize this repository with:", check 'Add README file'
- Select 'Create Repository'
- Create a new file
- Select the 'Add file' drop down menu
- Select 'Create new file' and name the new file 'index.html'.
- Paste in your html code from you text editor document to the blank index.html file next to the 1
- Once you've finished inputting your code, scroll down to the bottom of the page and select 'Commit New File'
- Enable GitHub Pages
- Go to the repository's Settings, which you access using the gear symbol in the upper right hand corner
- Scroll down to the section labeled 'GitHub Pages' and change the source branch selection from 'none' to 'master' and select save
- Note: The above two steps have changed. GitHub Pages now has its own tab accessible on the left side of the webpage. There is also no 'master' source branch selection, only 'None' and 'main'. I changed mine to 'main' and everything worked out fine.
- After a minute or two, your GitHub Page URL will be published online.
- It will look something like HTTPS:// [YOUR GITHUB NAME].github.io/[YOUR REPOSITORY NAME]/
- You can find your URL by navigating back to the GitHub Pages section in your repository settings.
Optional:
To further customize your map, check out the last page of Greenpeace's Co-op Activity Instructions **
Wrap up**
And there you have it! 🎉 You should have a brand new web map that live-updates with your data spreadsheet. If you need or want to edit the code for your web map, go back to GitHub, click on your repository, click on your "index.html" file, and click on the pencil icon in the top right of the box.
Here is a link to the practice web map I made! These steps create a very basic map with simple data conveyed, but I have found it's a quick and relatively easy jumping off point for visualizing data. Let me know how it works out for you and if you have any tips or tricks! 😃
2 Comments
This is a great guide! Thanks @laurel_mire -- you may also be interested in this new workflow by @barun1024 from our #gsoc Google Summer of Code program who made a system for pulling spreadsheet based maps into Leaflet Environmental Layers (LEL), for display alongside a variety of environmental data layers like SkyTruth, TRI, as well as JusticeMap and other relevant demographic information. It's very much in progress but might link nicely with the workflow you've described here. MapBox to my memory used to be Leaflet compatible as well so integration could be not too hard.
https://publiclab.org/notes/barun1024/08-22-2021/gsoc-2021-geographic-features-refinement-final-report
Barun focused on a workflow which would permanently add a spreadsheet layer to the collection of layers that make up LEL, and would not require knowledge of coding to initiate the process of integration. So a little different goal, but related! Enjoy!
Thank you @warren! I appreciate the link and will definitely take a look 😃
Reply to this comment...
Log in to comment
Login to comment.