
"The real voyage of discovery lies not in seeking new landscapes, but in looking at things with new eyes"
Marcel Proust La Prisonnière , 1925
WHAT ARE GOOD SOURCES OF HISTORICAL DATA FOR GRASSROOTS MAPPERS ?
On 7 June 2014 Public Lab Organizers met at Tidmarsh Farm Living Observatory in Cape Cod to talk geek stuff and play with water. They had fun.
Grassroots Mappers from the North Eastern US met to tell stories about Citizen Science tools they were using to better understand their neighborhoods, tools ranging from thermal light paint brushes for visualizing water pollution, to home made robot printed DIY kite infrared camera rigs to monitor plant health.
They also shared resources - online historical mapping databases of stories that could guide "What should we Observe ?"

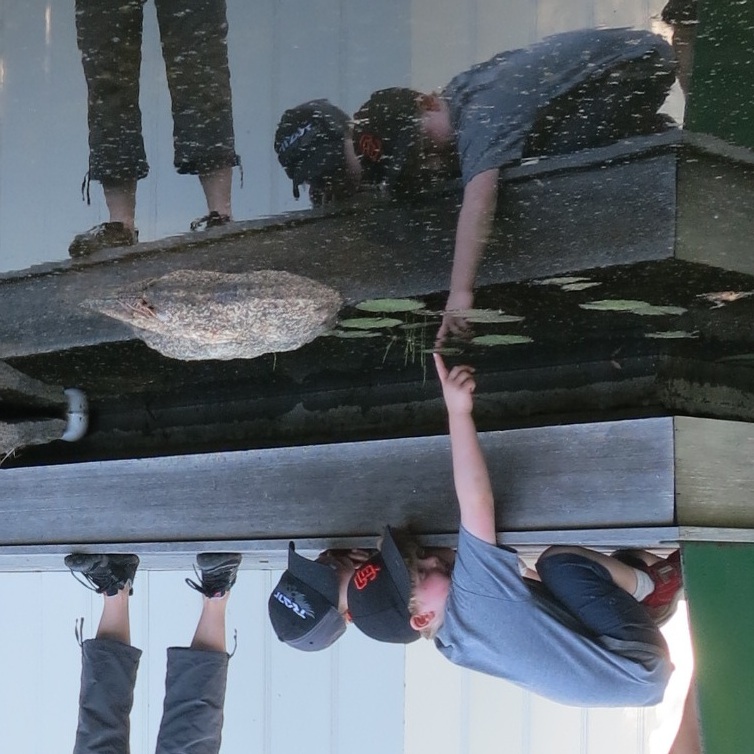
A Grassroot Mapper observing the Slow Story of Change.
OLD MAPS AS STORY BOOKS
Stories involve the flipping of pages through a narrative of time. In the Pixel Age, they involve the movement of digital data through space and time, and one of the revolutions of modern Internet story telling technology is that when a hand drawn 200 year old map becomes digital, it can move - the map can live again to provide depth to the modern story, helping the person standing on an abandoned cranberry farm in Cape Cod answer the question "What Happened ?"
Digital Historical Map Repositories become valuable resources for defining the arc of the story of Change.
Below were some of the key Map Libraries consulted that were useful for understanding the story of the Living Observatory.
The David Rumsey Map archive (http://www.davidrumsey.com/)
1890 USGS Geological Survey, Plymouth Sheet


This 1890 United States Geological Survey Map allows for a better understanding of Tidmarsh Farms historical tidal estuarine marsh ecology. The map depicts what is now a cranberry plantation as a large pond. Beaver Dam Brook is shown virtually unimpeded, with the shoreline dune structure of White Horse Beach filtering the outflows of the creek into Cape Cod Bay. This allowed for the spawning migration of alewife, blue back herring and other anadromous fish that would have used the marshes as an important fish nursery.

The original contours shown on the map now allow for speculative study on the origins of the watershed's water supplies, and landscape alterations caused by sand mining, dams and roads over the past century.
When studying historical maps, it is important to always be aware of human agency, constantly changing the landscape, from Indian controlled burns, to beavers, to modern roads. What may seem like a "natural" pond, may be a dam.
More detailed maps are needed.
To understand these nuances, it is critical to listen to the local story, to move from the internet to talking to the local residents who understand best the changes that happened in their backyards. Gloriana Davenport, who hosted the Public Lab weekend provided this even earlier map, showing how the original glacial kettle ponds of the Tidmarsh Farm had been expanded by flooding from a Mill Dam.

The Museum of American Memory (http://memory.loc.gov/ammem/)
Another good resource is the map collection from the US Library of Congress
The 1776 Cape Cod Bay Coastal Survey

This 1776 Coastal Survey by London cartographer Joseph des Barres shows Beaver Dam Creek as having been in theory navigable during high tide. This raises the question whether White Horse Beach, the natural sand dune "dam" creating Bartlett Pond was a fluctuating one, periodically washed out by ocean storms, and then replenished by sedimentary deposits from the Creek.
To answer this level of detail, The USGS Hassler Survey, the first Coastal Survey carried out by America as an independent nation, is invaluable.
The original "T" sheets, the hand drawn pencil sheets of field notes are available online at the University of Alabama, giving detailed historical coastland wetland data from the 1830s to the 1870's
The USGS Hassler Coastal Survey
1866 Coastal Survey - Sheet 1063a - Cape Cod Bay, western shore, from Eel River to Ship Pond
(above map library links uses Mr Sid map viewer plugin, which will not work with Mac computers - see below for map)
Many of these are duplicated in published form in the NOAA Coastal library

Viewing Tip: these maps are in ".SID" format, requiring downloading an online viewer from LizardTech (www.lizardtech.com). Unfortunately the viewer is supported only via Windows based machines. Another viewing tip: to download the maps at higher resolutions, you can adjust the on screen pixel specifications in the address line: eg T-1063a.sid&wid=1000&hei=800 becomes T-1063a.sid&wid=3000&hei=2400. (full resolution is 4302 x7670)

1866 View of the Mouth of Beaver Brook Creek, flowing into Cape Cod Bay, with White Horse Beach dunes.

The Hassler T Sheets were later developed into the Coastal Navigation Charts which also included bathymetric soundings, showing patterns of mudbanks and rocks

At the turn of the century, the Cape Cod shoreline started getting developed, often with temporary summer structures. These evolved into permanent settlements, often outside of the City planning and environmental best practices guidelines. Parts of Bartlett Pond became landfilled, and along with the increased use of septic tanks, the pollution hydrology and outflows of the creek became altered.

Circa 2010 Google aerial showing landfilling of pond by septic tank connected residences, and the alteration of the sediment outflow regime of Beaver Dam Creek, potentially affecting sediment replenishment of adjacent coastal wetlands
THE PILGRIM NUCLEAR POWER PLANT
Another interesting shoreline site is that of the Pilgrim Nuclear Power Plant. It was built around 1972 on a tidal marsh.
1866 Coastal Survey Map of the Pilgrim Nuclear Plant Site

This 1877 version of the same survey shows residential homes now being built on the marsh. It is important to note that Cape Cod Bay being salt water (undrinkable) that this bayside settlement was only possible because of the availability of a nearby fresh water spring. Based on topography, this spring was most likely to the south of the marsh, and would have fed a stream running under the Pilgrim Nuclear Plant.

The stream is not clearly marked on the above map, meaning it was minor or only flowed seasonally. Of particular interest in the southern end of the Nuclear Plant site is a bend in the road. The colonial path avoided an obstacle, which based on the 10 foot contour line was probably the source of the stream running northwards across the site.
1866 USGS Map showing contour typical of a trench that would have been eroded by a stream.

1890 USGS Map showing same "stream" contour without marsh and forest vegetation

The Google Aerial (circa 2010) indicates a surviving water feature among the trees, near the nuclear plant entrance, most likely a spring fed pond requiring field investigation. This raises the question of how historic water flow patterns now cross the nuclear plant site, and what their impact will be given flooding disaster scenarios and climate change.

The sedimentary layers of Internet aerials have become so dense that they are the equivalent of Instagram Selfies for Cities.
BING & GOOGLE AERIALS (www.bing.com/maps/)
With the hundreds of aerial views accumulating for particular sites, when researching a particular location, it is worth glancing at the Bing Birds Eye aerials to see if they show any unusual water outflows around the study site.
Oddly, on the Bing Pictometry aerial for the Pilgrim Nuclear Power Plant, someone has gone through the effort to mask the water in front of the nuclear plant with air brushed water (unlike the rest of Cape Cod coast, where sand banks are still clearly visible).

The nuclear plant buildings have also been pixelated: effectively "censored".

Marine ecology along the beach switches from legible to blurred as it approaches the nuclear plant. The "hidden story" becomes the topic of interest.

What is odd however is that not all the Bing Pictometry view angles of the nuclear plant seem to have been subjected to the censor's whims.

Here the over heated water pouring out of the nuclear plants cooling system shows up as a brown tinted plume, fluctuating with the tides.
With luck, by studying various generations of aerials, the extent of the thermal plume can be measured for different years since the power plant was built in 1972
Some good historical aerial databases to explore for finding "uncensored" images of water pollution:
You can chat with Oliver to download historical aerials

We found thermal plume records using Landsat: http://landsatlook.usgs.gov/
Conditions on the site prior to plant construction can be studied here: http://www.historicaerials.com/
Often faint color variations in water color can be enhanced using free photographic software such as Gimp to bring out areas of fish kill and oxygen depletion zones created by the over heated outflows.

The above aerial shows a historical aerial enhanced to map the extent of the pollution plume.
Cape Cod Bay Watch held a workshop with Public Lab at the Jones River Landing Environmental Heritage Center to study various safety issues at the plant in the light of the Fukushima disaster.


Karen from Cape Cod Bay Watch explaining safety measures that could be taken at the plant.
The "unconference" also included a workshop by Kaya Simmons on building thermal light paintbrushes that allow the digital painting of temperature fluctuations to map the extent of thermal pollution plumes.


These do it yourself science based tools will allow for better citizen monitoring of the issues of concern to local residents.
2 Comments
I love the in-depth historical storytelling. awesome research and thanks for showing others how to follow your process.
Reply to this comment...
Log in to comment
Wow! Interesting, amazing, and incredibly helpful!
Reply to this comment...
Log in to comment
Login to comment.