The problem
The Suquía River crosses the city of Córdoba (Argentina) and on its way provides ecosystem services. However, it is a river with a small flow (approximately 10 m3/s) for the size of the city that sits on its banks (approximately 1.5 million inhabitants).
 Taken from Open Street Map under license CC BY-SA 2.0
Although this river has very considerable punctual impacts, rain drains are seen on its route through the city that release waters of doubtful appearance and nature into the channel. This is the case of the drain that spill into Isla de los Patos, a place used by citizens for recreational activities. The water that comes out of the drain has an disgusting smell, and generates a mucus and a channel with a gray background, very similar to that described by @jesseslone in his comment to post

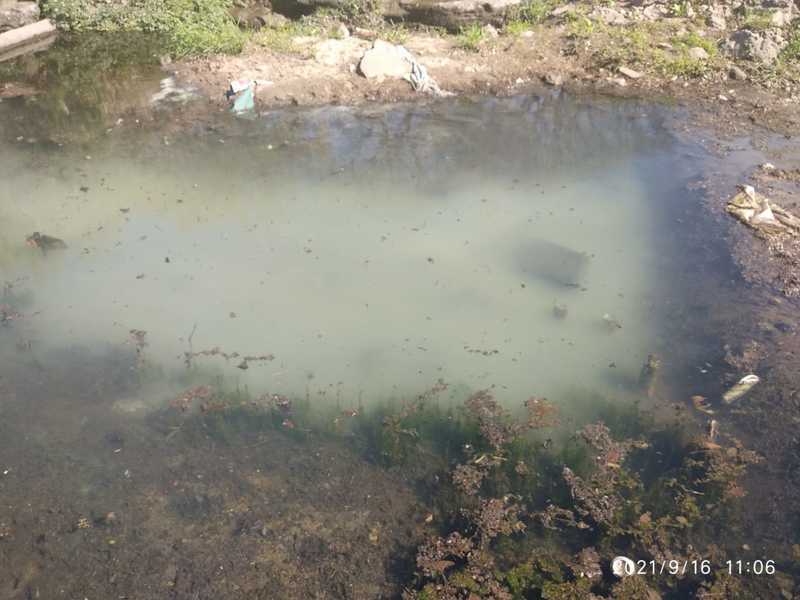
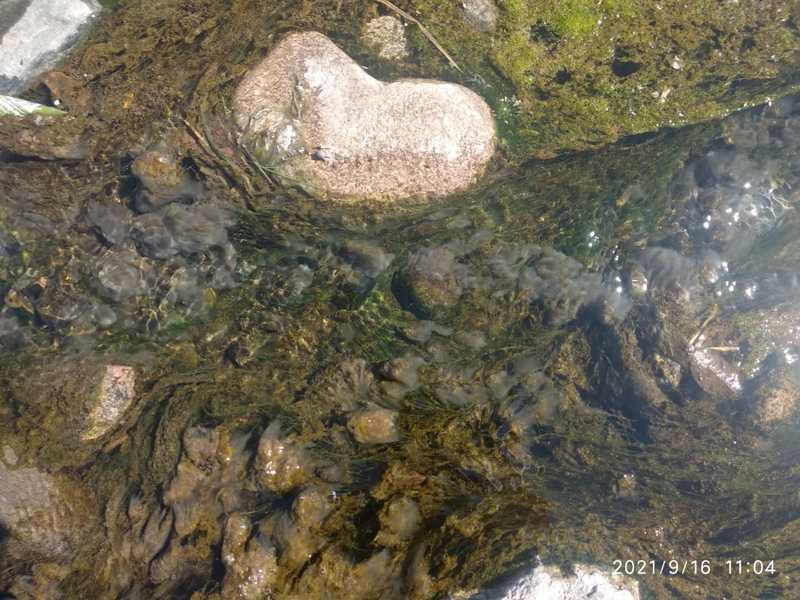
It is because of this supposed environmental damage that it was decided to use PublicLab tools to study the drain and try to determine if something inappropriate was being spilling to the course of the Suquía River.
Methodology
Study site
The place that was chosen to study is in the center of a city of approximately 1.5 million inhabitants. At this point there is an Island that serves as a place of recreation. Around the island there is a storm drain that releases water all year round, even when it has not rained for months (suspicious). The sampling sites were: S1: site before drainage; S2: drain; and S3: post-drainage site. The distance between the sites was approximately 75 m.
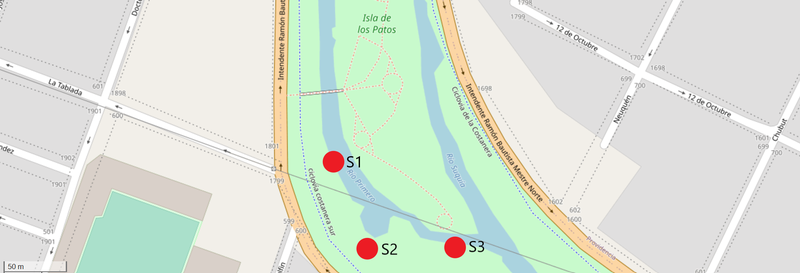
Selected sites to study the effect of drainage.
AppEar
The AppEar mobile application was used to determine if the aquatic ecosystem (the watercourse as well as its surroundings) was being affected by the drain. For this, the step-by-step tool activity was used as a guide. It should be clarified that this tool only gives a general idea of the state of the environment, it does not specifically determine whether there is wastewater in the drain.

Tampon tool
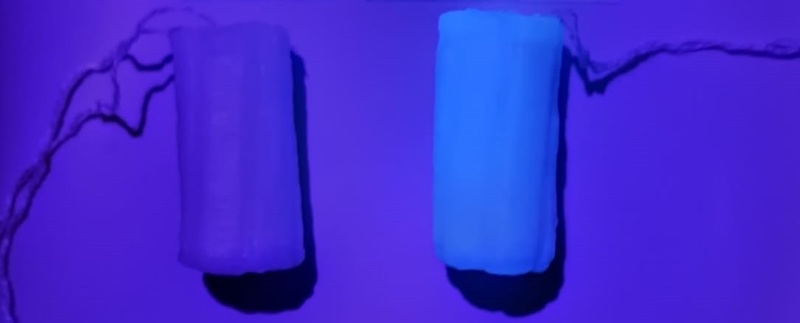
Buffers were used to determine at the various sites whether there were optical brighteners in the water. This tool is extremely useful to study the presence of household wastewater. Optical brighteners are extremely common in liquid laundry soaps and in many personal care and hygiene items such as toilet paper and carilin. To use this tool we rely on the step-by-step activity that is described.
Bioindicators
The presence of different groups of aquatic invertebrates at the sites of interest was used to determine the presence of multistressors. This tool allows us to detect if the studied site is predominantly inhabited by animals resistant to pollution or if there is a good proportion of those that need optimal water quality conditions. To carry out this activity we use the step-by-step activity that describes the use of the tool.

Private tools
It was used to perform an intercalibration of techniques and to compare results proprietary tools commonly used to measure classical parameters of water quality. For this a meter was used
of total dissolved solids (Brand Sanzhileg TDS Meter Tester), a pH meter (Brand ATC PH107) and dissolved oxygen determination kit (Tetra test Oxygen).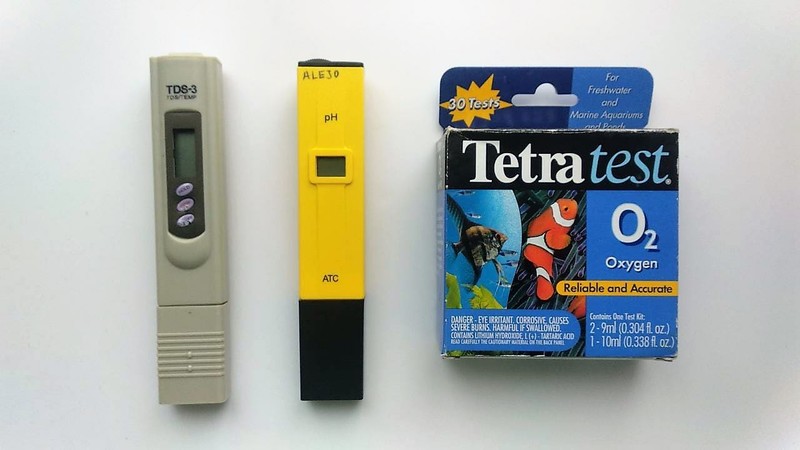
Results
Visits
The study area was visited on 2 occasions. The first visit was on 9/8/2021, that day the river had a somewhat brown color and it was because it had been raining the previous days. That day only the buffers were left in place to adsorb on optical brighteners.
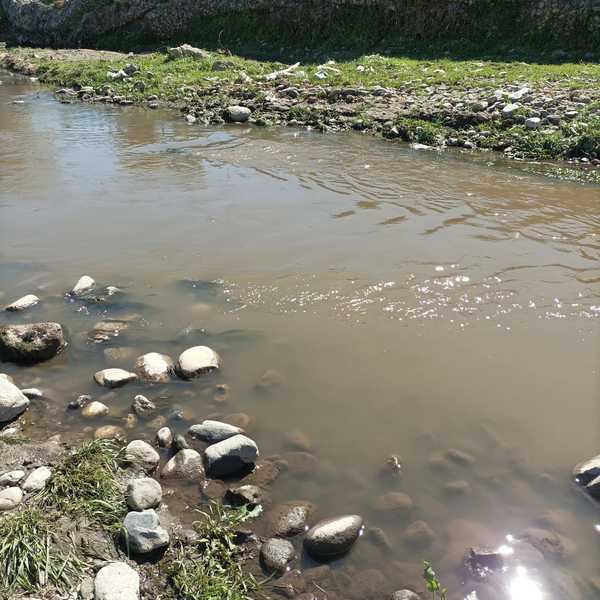
Aspect of the Suquía river on the day 09/08/2021
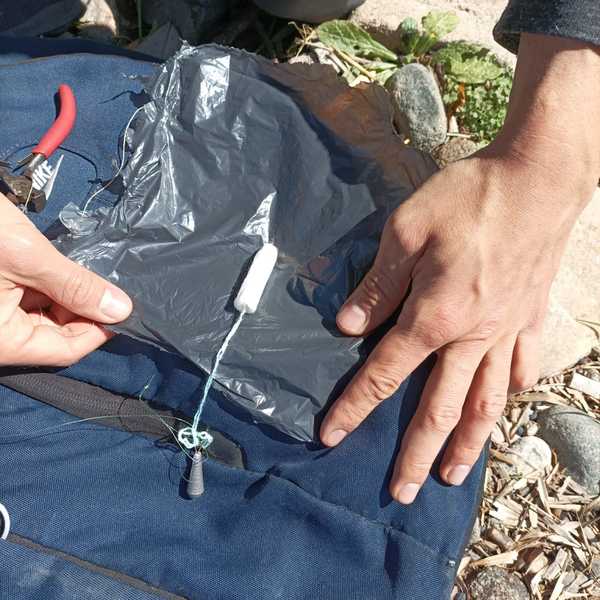
Weighted tampon and a dark cover to prevent decay of optical brighteners in sunlight
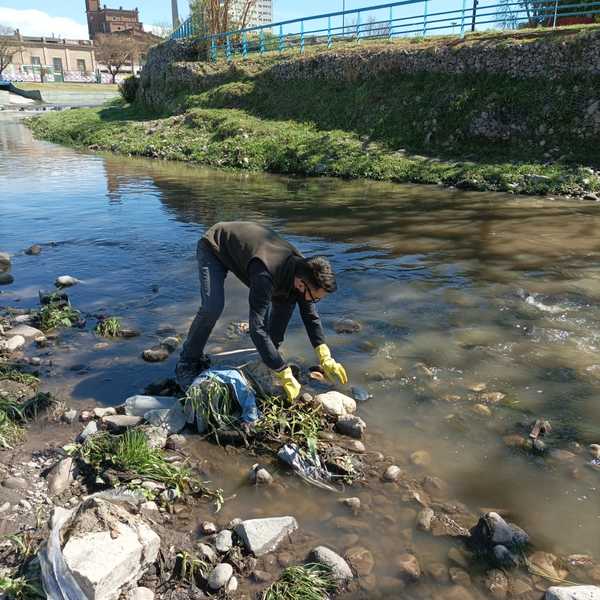
Depositing a tampon in one of the study sites
The second visit was made on 09/16/2021. On this occasion, the buffers were collected, the evaluation was carried out with the AppEar application and the bioindicators present in the S1, S2 and S3 sites were analyzed. This time the river water was transparent due to the lack of rain the previous days.

AppEar
The AppEar application gave the same value in the places upstream and downstream of the drain (S1 and S3, respectively), the score for the environment being 81% quality, the negative aspect found in the environment being the presence of garbage. The drain (S2) gave a lower value than the aforementioned sites 71%, being the negative aspects in the environment the presence of garbage and the bad smell. 
Tampons
The tampons activity did not give results for 2 sites (S1 and S3) since these were out of the water from the first visit. This was due to the fact that between the first and the second visit the level of the river dropped which caused these buffers to remain above the water level. For this reason, the presence or absence of optical brighteners could not be measured. S2 tampon was submerged throughout the study period, however, it did not show a higher gloss in UV light than the buffer in distilled water.

Bioindicators
The aquatic invertebrates found in the different sites gave different results depending on the site in question. Thus, for the site upstream of the drain (S1) it gave the highest value of GWQI (38%) and the lowest value of BQWI (4%). The drainage site (S2) gave the lowest GWQI value (0%) and the highest BQWI value (21%). Finally, the site downstream of the drain (S3) showed intermediate values for both indices, GWQI 33% and BQWI 12%.

Standard water quality measurements
The proprietary water quality tools determined differences between the environments studied. The site upstream of the drain (S1) showed the following values: 486 ppm of total dissolved solids, 7.4 of pH and 8 mg / L of dissolved oxygen value. The drainage site (S2) showed the following values: 202 ppm of total dissolved solids, 8.1 of pH and 5 mg / L of dissolved oxygen value. Finally, the site downstream of the drain showed the following values: 475 ppm of total dissolved solids, 7.4 of pH and 10 mg / L of dissolved oxygen value.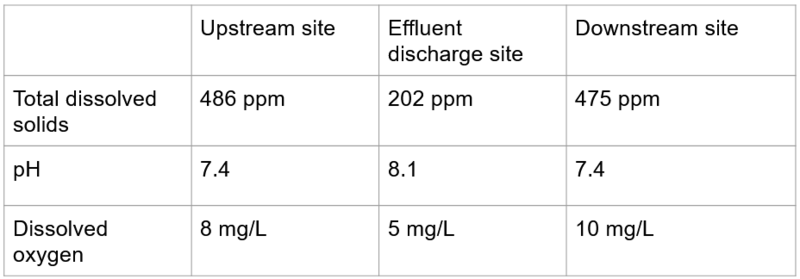
Conclusions
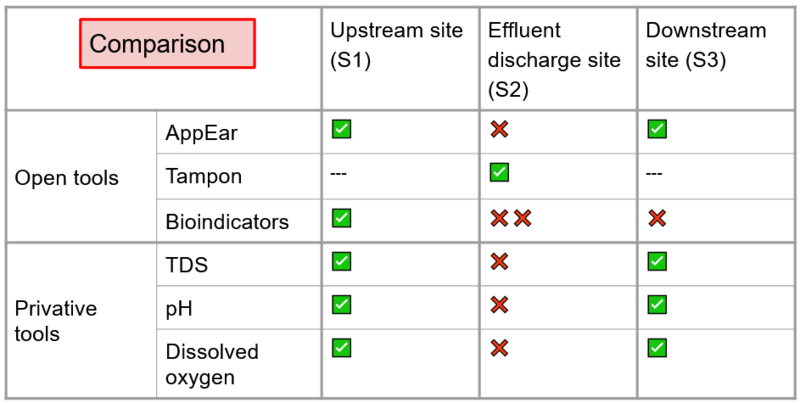
The results obtained show how the open tools and tools for community science are useful to show changes in the environment due to anthropic disturbances, except for the buffer tool that due to contingencies could not be correctly validated. These open tools showed a decrease in quality in the case of drainage through the AppEar mobile application. On the other hand, the use of indices based on bioindicators not only showed a deterioration in water quality at the drainage site, but also at the site downstream of it. The values of the proprietary and standard tools for water quality were able to show only the deterioration of the water quality in the drainage environment, but not in the downstream environment. This case study shows how open tools are not only accessible and easy to interpret, but also provide more information than standard and proprietary ones.

1 Comments
@bhamster awards a barnstar to alejobonifacio for their awesome contribution!
Reply to this comment...
Log in to comment
Login to comment.