Intro
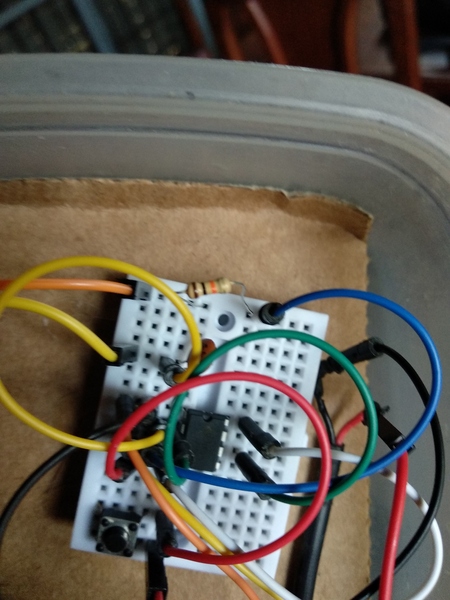
I tried to calibrate the Coqui conductivity sensor but I wanted to avoid the overheating of the buzzer. Then I used a 10 kohm resistor and a 10uf capacitor.

The problem
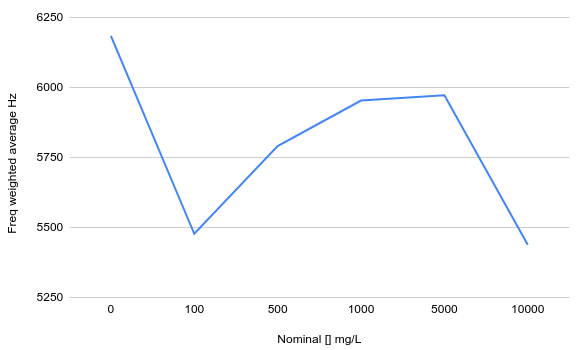
Later I recorded the sound of different water samples. I did it that because I wanted to get a numerical data from the sound produced by the Coqui as was proposed in different notes (analyzing coqui signal and building a coqui and analyzing its sound). But I didn’t get a good linearity. I get these curves:

Nominal concentrations of salt in tap water vs average frequency of the sound produced by the buzzer. This method I taken from @bhamster note
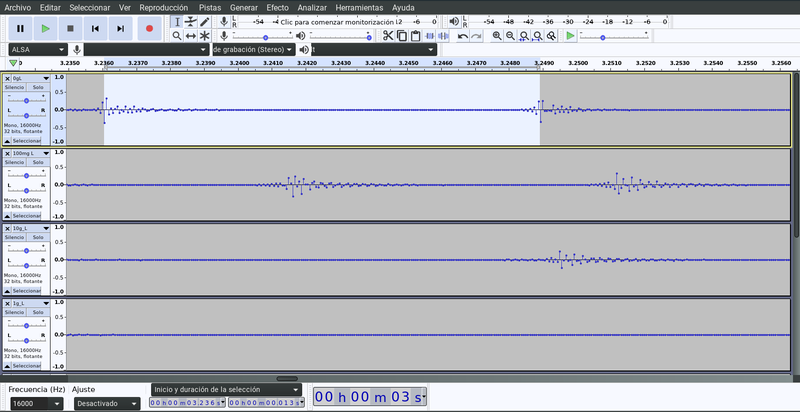
Because the linearity was not so good I decided to try another variable to see if I get better fitting. I remember that 555 works like giving pulses, then I decided to measure the distance between peaks as measurement of conductivity.

In audacity software you could measure the distance between peaks in milliseconds
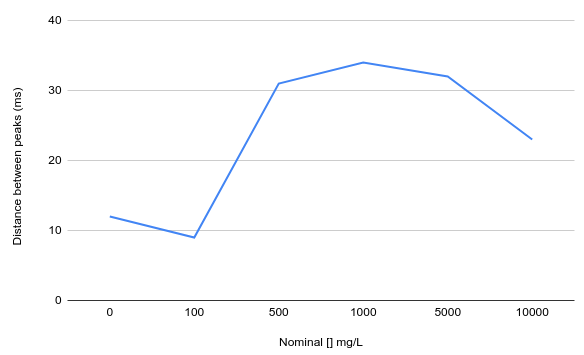
The problem continues there, the curve gets no good linearity.

Nominal concentrations of salt in tap water vs the distance between the peak of loud sound produced the buzzer
In both cases, the first problem was on the tap water (0 g/L) and its higher value than the low salt concentration samples (0.1 g/L). The second problem was the flattening in the more salty samples (5 and 10 g/L).
Conclusions
The possibility of contamination of the samples I dismissed because I measured the total dissolved solids in the samples and I see bigger TDS lectures as bigger was the nominal concentration of salt. Although, at more salty samples the curve gets flatten.

Relationship between nominal concentrations of salt and TDS.
I think that this coqui could be useful at a small range of salinities/conductivity. Seeing the results that I get the range more usable could be between 0.1 - 1 g/L. Also, in this range are the salinities of most rivers in my zone.
Next steps
- To make a new curve with more points between 0.1 - 1 g/L.
- Improve the design of coqui following the Don Blair recommendations. Later doing the curve, I began to search for answers on the publiclab website, then I read this old post of Don Blair talking about the bias in the duty cycle of 555 IC.

3 Comments
Hi @alejobonifacio i wonder if there is an 'ideal' range if we can use resistors or capacitor sizes to shift that to our looked-for "search range" that might be expected in a river or body of water. Though it sounds like you are finding that 0.1 - 1 g/L is already a useful range?
Is this a question? Click here to post it to the Questions page.
Hi @warren! Yes, 0.1-1 g/L is a useful range at least in rivers in this part of the world, in fact for this river test it worked well. I still have to try the configuration of resistors and capacitors suggested by @donblair
Reply to this comment...
Log in to comment
Thank you for this close and careful work <3
Reply to this comment...
Log in to comment
Login to comment.