Abstract
This note provides an example of satellite image processing using OpenStreetMap (OSM) data mining tools and Jupyter interactive computing environment. Park areas of Nottingham, England are identified and compared using Planet satellite image data and overpass-turbo overlays.
Introduction
- This note demonstrates how satellite imagery can be combined with OSM data to highlight and isolate different environmental features.
- Tools used in this example include:
- Planet satellite data with 3m resolution (Nottingham England, July 2019). Nottingham, UK was selected in support of @molangmuir10 urban greening studies and MapKnitter evaluations..
- The overpass-turbo application that provides the ability to filter OpenStreetMap data and identify features such as parks.
- Jupiter python notebook was used as the processing environment to enable GDAL and rasterio libraries that allow access to geospatial data.
- ‘Greeness’ (green over average red and blue channel) is used to highlight park differences. NDVI comparison could also be used but greeness was selected since it permits an easier comparison with standard video or photography.
Application
- This demo demonstrates the use of satellite imagery to isolate and process park environmental data. The same techniques could also be used to monitor other environmental concerns of interest to the Public Lab community. Other possible features such as waste disposal, pipelines, industrial monitoring, etc. can also be reviewed.
- While this example uses the Jupyter notebook environment, similar processing tools are embedded within MapKnitter, Image Sequencer, and Leaflet Public Lab applications. The note is designed to illustrate how future applications could mix these different tools for environmental comparisons.
Walkthrough
Major processing steps are described below:
- The first step is to query Planet’s satellite imagery database for scenes with no cloud cover.

- The next step is to select, merge and download the different satellite images in a geoTIFF format. The picture below is a composite of the R,G,B channels.
 3. GDAL is used to select a portion of the image to make the processing more manageable.
 4. Switching to the overpass-turbo application, request information about all the parks in Nottingham. Park shape and location data is stored in a GeoJSON file
 5. Park information and satellite imagery are mixed and compared. This graph shows the level of greeness (green/(red+blue)) for each park. This is done by overlaying the park shape over the satellite image and calculating the average greeness per pixel over the other two channels.
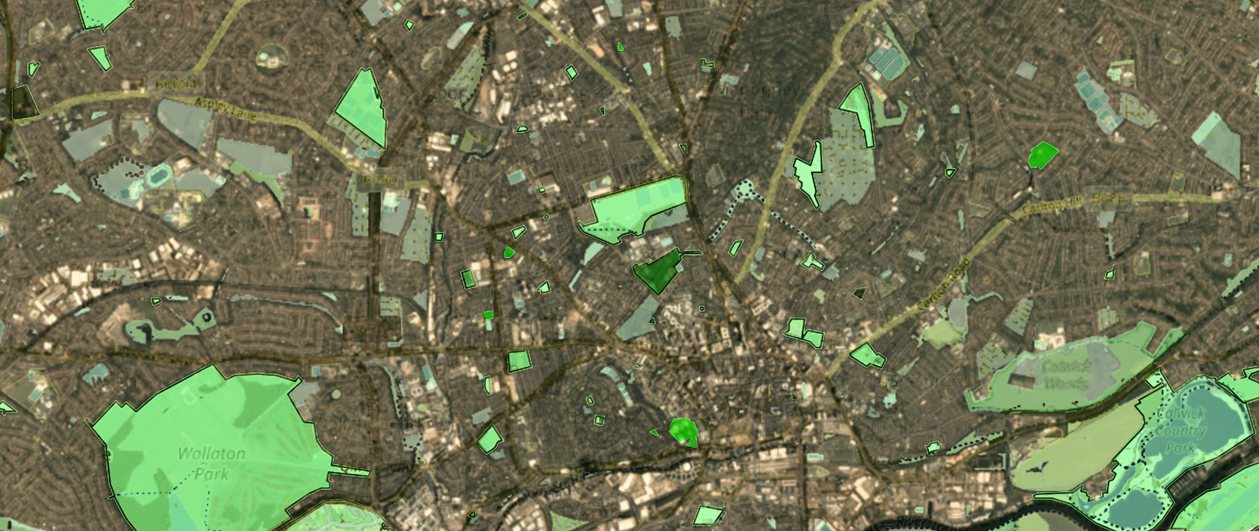
 6. Park greeness is displayed over OSM and satellite maps by scaling the opacity.

 7. Scenes are ported into MapKnitter for comparison with other types of imagery.
MapKnitter overlay: https://mapknitter.org/maps/shades-of-green-overlay-of-nottingham-parks
7. Scenes are ported into MapKnitter for comparison with other types of imagery.
MapKnitter overlay: https://mapknitter.org/maps/shades-of-green-overlay-of-nottingham-parks
Summary
The note demonstrates how OSM data can be merged with satellite imagery to highlight and compare select areas of interest. Demonstration involves the uses of GDAL, rasterio, Planet API’s and Jupyter notebook processing tools.
References
Code available at:
- https://github.com/MargaretAN9/GSOC-2019/tree/master/sattelliteImageProcess
- https://github.com/MargaretAN9/GSOC-2019/edit/master/sattelliteImageProcess/greenOperpassExV1.ipynb
OSM approach was first demonstrated by Katherine Scott and can be found at:
Planet APIs available at:
MapKnitter overlay:
This effort is GSOC 2019 effort available at:
Planet Imagery Reference: Planet Team (2018). Planet Application Program Interface: In Space for Life on Earth. San Francisco, CA. https://api.planet.com.
3 Comments
Amazing.
Reply to this comment...
Log in to comment
@molangmuir10 check this out!
Reply to this comment...
Log in to comment
Your work has been featured with attribution in the WeeklyOSM news! Congrats! Here's the link: http://weeklyosm.eu/archives/12335
Reply to this comment...
Log in to comment
Login to comment.