


Chlorophyll and other pigments in green plants absorb blue and red light to power photosynthesis, and reflect away green light. The combination of colors used by plants is referred to as photosynthetically active radiation (PAR). We don't really know why the only pigments plants have don't use much green light, but it might be related to the presence in Earth's early oceans of microbes that used green light as an energy source and had it monopolized. The earliest green plants might have been better able to compete with ancient purple Archaea by exploiting the unused blue and red wavelengths. Some surviving Archaea still use green light today, but the photosynthetic pathways supported by the pigments in green plants are much more efficient.
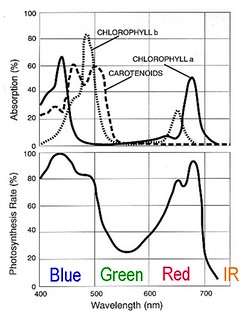 The absorption of different wavelengths of visible light by photosynthetic pigments and the resulting spectral response of photosynthetic rate. Leaves appear green because the pigments do not absorb green wavelengths and reflect them for us to see. Modified from: en.wikipedia.org/wiki/File:Par_action_spectrum.gif
We do have a good understanding of which wavelengths of light are used by plant pigments today. A standard high school or college lab exercise is to extract the pigments from plant leaves and separate them using chromatography or describe them using spectroscopy. The extraction is typically done with nasty solvents, and one lab manual calls for a mixture of petroleum ether, cyclohexane, ethyl acetate, acetone, and methanol. I'm sure there is a reason to use those solvents, but this afternoon I put a handful of spinach leaves in the blender with some cold water and made a lovely green slurry. I filtered it through a gold tea strainer, diluted it, and put a jar of the emerald liquid in front of Ebert's entrance slit. I also captured a spectrum of an identical jar of water.
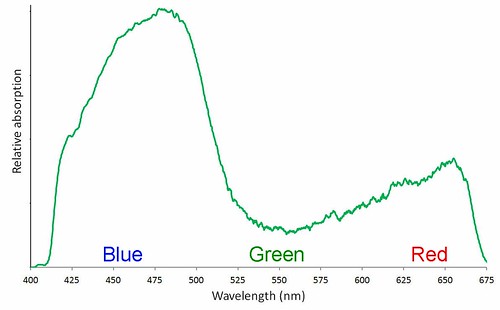 The relative absorption of visible wavelengths by an extract of spinach leaves. These values are the difference between the transmission through water and the transmission through a water extract of spinach leaves, both captured by Ebert.
I uploaded both images to Spectral Workbench and then downloaded the raw data and put it in Excel. I used the same data procedure that I used on the maple syrup results: for each wavelength value I used the intensity value for whichever color channel was highest, then I smoothed the series with a 10 value running mean. To represent how much light of each wavelength the green spinach liquid was absorbing, I subtracted the spinach transmission intensity values from the clear water transmission values.
The result looks a little bit like the standard absorption curve for plant pigments. It certainly depicts less absorption by green light, and more by both blue and red. I am not sure why the absorption at the red end of the spectrum is not as great as in the standard curve. Maybe there was not as much chlorophyll a as chlorophyll b. Or maybe the white balance of the digital image is to blame. Or maybe the artifacts associated with combining the three color channels are responsible. Or maybe I need more toxic solvents to extract the pigments.
13 Comments
"I filtered it through a gold tea strainer" Man, I can't hold a candle to that!
Reply to this comment...
Log in to comment
"I filtered it through a gold tea strainer" Man, I can't hold a candle to that!
Reply to this comment...
Log in to comment
I guess they plate the stainless steel mesh with gold to keep metallic flavors out of your tea (also used for coffee filters). I noticed it in the back of a drawer last week when I was looking for something to filter the maple syrup with. It worked superbly for spinach juice.
Reply to this comment...
Log in to comment
Hi Chris, How did you pick the color channel with the highest value? Did you write an expression for Excel to pick the highest value and use that? If you did, would you mind posting that expression?
Is this a question? Click here to post it to the Questions page.
Reply to this comment...
Log in to comment
Tom, I'm glad you asked. The proper Excel expression for choosing the greatest among three values did not come to me quickly, so I just used the equivalent of: if(red>green,red,green) for the part of the spectrum where blue was always close to zero and a similar expression for where red was always close to zero. If anyone knows a single Excel expression that will always choose the greatest of three values, please let us know.
Reply to this comment...
Log in to comment
A simpler formula is: =max(red:blue)
Reply to this comment...
Log in to comment
Blown out data should show up as 255 in the csv file and thus would appear in a graph as peaks with a flat top (plateau) when graphed in excel, and presumably this same plateau situation would show up in SpectralWorkbench as well. However, looking at one of my excel spreadsheets shows a max value of 257. How does SpectralWorkbench get that? 8bits per pixel is 2 to the 8th power (28) which is 256, so values should be 0-255. What am I missing?
Is this a question? Click here to post it to the Questions page.
Reply to this comment...
Log in to comment
I think the essence here is that you have to watch carefully what is going on and choose a method that seems most appropriate for the situation. That is probably best done by doing the Excel evaluation, and seems like it would be very difficult to do in SpectralWorkbench directly. \r\nI wish there were low cost b/w webcams available because then one would just have to deal with one sensitivity curve instead of overlapping rgb curves. The imaging chip in the webcam that I have partly torn apart has a cover over it. For most purposes that is very good, but I would like to be able to get at the bare chip to see if the color filters are on the top of the stack and exposed to the environment (except for that sort of coverslip that goes over the whole package). If one could access the imager directly then there is some hope of being able to dissolve or bleach the filters. Does anyone know if there is a technique for removing the "coverslip" without wrecking the imaging chip?
Is this a question? Click here to post it to the Questions page.
Reply to this comment...
Log in to comment
Perhaps I missed the explination but please help me understand why you don't just sum the 3 bands. It seems to me that the operative filter is the grating and you want to know the total amount of light hitting a region of the sensor. The color of the light has already been established from the grating and you just want an intensity value at that location. It would seem wrong to me to throw away some intensity information when trying to improve sensitivity to low values. Perhaps that is just the low value end of the scale. On the high end of the scale; with a band of saturation in one channel the other channels usually are not saturated so it would seem that they would provide relavant intensity information. Thus summing all channels makes sense to me.
Reply to this comment...
Log in to comment
The Bayer filter is frustrating, but if we can figure it out, it might be a hidden plus for us; in some ways, the R, G, and B channels can be treated as 3 different exposures in a high dynamic range (HDR) image of the spectrum. If we can come up with a standard way to consistently combine the bands, we could deal with low exposure and overexposure as long as at least one of the bands has a good response.
Tom, i think you found a bug in SW's data export. I'm assuming it's a rounding error, perhaps when intensity data is being converted from a float to an int before being summed in all 3 channels. I suppose I should fix that :-P
Reply to this comment...
Log in to comment
Dan, you are correct that all we want to know is how the light intensity varies across the sensor where the grating has spread out the spectrum. Unfortunately, we are using consumer digital cameras, and to make a colorblind sensor see in color, they use Bryce Bayer's 1976 system which inserts an array of color filters and an interpolation algorithm between us and those photons impacting the sensor. What the camera gives us is really rather messy, and not what we need for spectroscopy, although it can be used to make incredibly good color photos.
When certain colors hit the Bayer filters, only one filter transmits them, but other colors pass through all three filters and inform three different color channels (r,g,b,). So for some parts of the spectrum, there is information in all three color channels. A simple way of combining that information is to average the three channels. The sum of the three channels does not have any more information that the mean. Multiply the mean by 3 and you get the sum -- it's just scaled differently. Multiply the mean or the sum by any factor and you have the same information. Graph them all with the Y axis scaled differently for each and the graphs can overly each other perfectly.
The issue is that the Bayer system is not designed to allow us to precisely compare the intensity of light hitting two different places on the camera's sensor if that light was not the same color. This is mostly because the color channels are not discreet, e.g., the blue channel can have information about green light -- the channels overlap. Where the green and blue channels overlap, the blue channels picks up as the green channel sensitivity fades out, but the transition is imperfect. Summing or averaging across that transition produces conspicuous artifacts (values higher than on either side of the overlap). In addition, different wavelengths of green light will be recorded in the green channel as having different intensities, even if the incoming light had identical intensity for all wavelengths. So take a photo of a continuous spectrum with identical intensity at all wavelengths, and the photo will record wild fluctuations in intensity across the spectrum. For a single camera, these fluctuations are probably constant and predictable. So it should be possible to derive a calibration routine which corrects each wavelength for intensity. I guess.
Reply to this comment...
Log in to comment
=max(blue:red) is soo much easier. Thanks.
The greater of three method seems to be useful for transmission or absorption spectra when a continuous light source is used. It can be more or less valid even when one channel is blown out, although that situation means information has been lost no matter what you do. The algorithm could switch to the next highest channel when one is blown. If more than one channel is blown out, an additional algorithm might be needed to choose a channel, although blown channels all have the same value so it might not matter which was chosen.
For emission spectra, the greater of three approach should not be used when channels are blown out. Often a secondary channel allows an emission peak to be resolved. If a channel is blown out, a complex algorithm might be needed to preserve the peaks better than an average does. If no channel is blown out, the greater of three approach would generally produce a spectrum with higher and more distinct peaks. But the relative heights of peaks might change, so interpreting the relative intensity of each peak would be tricky. However, interpreting the relative intensity of the peaks when an average is used is also problematical.
Almost all of the CFL spectra I have uploaded to Spectral Workbench have blown out peaks, so the greater of three approach might not be applicable very often for CFL. But many of my other gas discharge tube spectra have no blown out peaks and might look better with the greater of three approach.
So it would be good to have the greater of three method as an alternate display, but people will have to be made aware of the ramifications of its use.
Reply to this comment...
Log in to comment
Excel allows nesting if statements, so:
if((if(red>green,red,green))>blue,(if(red>green,red,green)),blue)
should work, if you're not into the whole brevity thing.
Reply to this comment...
Log in to comment
Login to comment.