I wanted to jot down these URLs for a couple forums where there's been some really good thinking-out-loud on DIY spectrometry and the challenges we face. One is from a while back, on the OpenSpectrometer.com forum:
Hacker News: Uses for spectrometry
The other is on Hacker News, in response to the Kickstarter we launched today:
Hacker News discussion has been generating some great ideas:
tomkinstinch: If you can transmit light through a sample curvette to the spectrometer, you could use it to measure optical density (i.e. the amount of stuff in the way that blocks or scatters light). You could use that to measure the concentration of particulate in engine oil, or the strength of coffee. If you can detect at 405nm, you could measure blood coagulation time/extent (separate blood cells from plasma, measure attenuation at 405nm though plasma). You could cludge together a pulse oximeter if you can detect at 660nm and NIR (905, 910, 940nm) and have light sources to emit at these wavelengths. Absorbtion at these wavelengths changes as hemoglobin picks up and loses oxygen. The ratio at 660nm and one of the other wavelengths could be used to show blood oxygenation. If you were into photography or cinema, you could measure the emission spectrum of a light source and fit a blackbody curve to it to find its color temperature--useful for white balancing. If you wanted to match paint colors, you could use a spectrometer to do (along with some additional calculation and knowledge about your pigments). If you perform a flame test, you could use a spectrometer to learn about elemental composition.
Hackaday: Radiometric calibration
Hackaday has also been generating some great ideas. We've been discussing and working on many of these issues, but some are new and it's just great to hear other folks picking away at these challenges! Take a look:
AE5PH: While it is important to have a spectral library, it is also necessary to calibrate the spectrometer. Calibration comes in two forms; spectral calibration and radiometric calibration. Spectral calibration is required in order to know that each pixel represents a particular range of light wavelengths. This is usually performed by exposing the spectrometer to a light source with absorption and emission bands at known wavelengths, such as a neon gas lamp. Where these bands of absorption and emission fall on the detectors tells you what wavelengths each detector represents. Radiometric calibration is required in order to know the actual intensity of light falling on each detector according to the number value (counts) returned. Three factors that affect this are the spectral response of the detectors, the linearity of the detector outputs, and the spectral characteristics of the light source. The spectral response of the detectors indicates how they respond to light at different wavelengths. Given that most USB webcams use inexpensive silicon detectors, the response will not be the same for all wavelengths in the visible and infrared wavelengths. The peak will be around 600 nanometers and fall off with shorter and longer wavelengths. The same intensity of light at different wavelengths will yield different number values (counts) from the same detector. The linearity of the detector response needs to be known in order establish a relationship between the intensity of the light and the number of counts provided by the detectors. A doubling of the light intensity should result in a doubling of the counts value. The characteristics of the light source need to be known because few (if any) light sources have uniform intensity over all wavelengths of light. A light source, such as an incandescent or tungsten-halogen lamp, have characteristic black body spectral signatures, which are vastly different from fluorescent lamps. The spectral characteristics of the light source will weight the spectral characteristics of the reflectance spectral signature of the target material. This weighting will need to be compensated in order to retrieve the actual spectral signature of the target material.
Blue-ray discs
Finally, I found this interesting discussion from a while ago about whether Blue-ray disks would make better DIY spectrometers:
http://astro.u-strasbg.fr/~koppen/spectro/bluraye.html
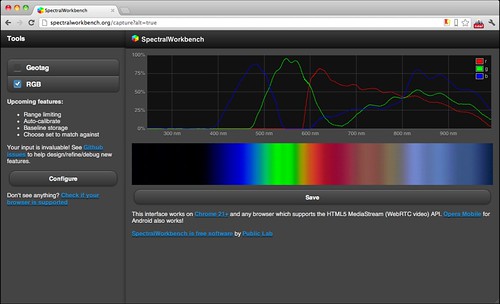
That link also mentions the moire effect from the spectrum aliasing with the pixels of the webcam. I wonder if that's related to what's happening in the following spectrum, where there is a wobble mixed in with the spectrum which gets longer towards the infrared end of the spectrum:
11 Comments
The issues mentioned in this URL could certainly be an issue (i.e. for your spectrum example) if the grating is not correctly aligned with the pixels of the sensor.
To properly answer your question, you also need to account for optical effects (i.e. lens and distance to sensor).
What is confusing about this link is that they claim to use monochrome mode. A true monochrome camera has pixels "larger" sensitive to a broader range of the spectrum, rather than adjacent pixels sensitive to R,G and B. Generally, monochrome on RGB is simply a combination.
Reply to this comment...
Log in to comment
Hi there! Did anybody sorted out the "wobble" problem? I have finally finished my own spectrometer after a few months of hard work and this kind of problem is bothering me. I tought it is some kind of moire but I can't sort out yet. My spectrometer is using a linear CCD with 3680 pixels and a quality 300 lines/mm transmission grating. Here are some pics:Home built linear CCD spectrometer
Is this a question? Click here to post it to the Questions page.
Reply to this comment...
Log in to comment
No, haven't had a chance... still looking a bit moire-ed
https://spectralworkbench.org/spectra/show/900
I was going to try putting a diffuser in the beam path. If you make any progress i'd love to see!
Wow, you have quite an impressive setup! Would you be interested in open sourcing it by posting at http://publiclaboratory.org/note/add ?
Is this a question? Click here to post it to the Questions page.
Reply to this comment...
Log in to comment
Hi Warren, sorry for posting so late but I tought my comment will not be published...:)
Your wobble is acceptable compared to mine: some spectra
I have found some info on this amateur astronomers site: CCD fringing 1 and CCD fringing 2. I am afraid my problem resides in the CCD protective glass. That's it, the devil is in details, despite I am using the same ccd as some major spectrometer manufacturers.
Yes, I was thinking to make it open source despite my project is a commercial one. As soon I will sort out the annoying interference fringes and finish the firmware I will make it available. Anyhow it was way too much work for one person and improvements from third party is welcome. Saddly the other open source spectrometer projects are not available. I mean Spectruino and openspectrometer
Regarding total cost I am now at around 200 USD. Obviously electronics are the cheaper part, the CCD was 25USD, ADC and Chipkit board another 40USD I guess. The grating was expensive, 105USD from Edmund optics. First surface mirror and collimating/focusing lens was recovered from a scraped Minolta color copier. But I think one can get a good spectrometer and more important it gets access to the pure raw data from sensor unlike in webcams.
Is this a question? Click here to post it to the Questions page.
Reply to this comment...
Log in to comment
Hi Jeff.
I found that the "wobbling" problem is in fact a nasty interferrence pattern which arise in the protective glass which covers the ccd/cmos chip. That's it, it seems that proffesional spectrometer suppliers are changing that glass with AR coated glass on both surfaces. So the small interference pattern you noticed in your webcam it's ok. So now I am stucked with this problem and struggling to subtract this signal by some sort of algorithm.
Reply to this comment...
Log in to comment
huh, interesting. It's the glass reflection interfering with what? between the two surfaces? A friend suggested that its between the width of the slit and something about the sensor. I wonder if varying the slit width can remove it?
Is this a question? Click here to post it to the Questions page.
Reply to this comment...
Log in to comment
It seems that reflections between the air/glass/air/silicon boundaries adds constructively and destructively to make the interference fringes. Also is dependant of glass thickness. The fringe spacing is decreasing toward the red (NIR) edge. After all this chips are manufactured for imaging white light. Surfing the web I noticed that amateur and also professional astronomers have encountered this kind of problem when trying to build custom made spectrometers with comercial available ccd chips. Spectrometer manufacturers are changing that protective glass with some kind of wedged glass (not parallel surfaces) or AR coated glass. Obviously removing the protective glass is very difficult and risky operation. I also suspected that is some kind of slit diffraction projected onto the chip and I tried with several slit spacing from 50 microns to around 500 microns. The fringing was still there with exact spacing increasing toward red, only the amplitude was lower perhaps because of losing resolution with increasing slit width. Not to mention that I have changed the lenses, mirrors, diffractions gratings (glass 300 l/mm, plastic foil 500 l/mm, plastic foil 1000 l/mm) without any success. So that's it I am struggling now with math to find a way to supress the fringes without loosing signal information. By the way here is a simple method to calculate the slit width using only a laser pointer and a ruler slit width calculator
Reply to this comment...
Log in to comment
Oops! Sorry, the slit width calculator link is here Is in French but is easy to understand.
Reply to this comment...
Log in to comment
Looking back through the history to catch up while anxiously waiting to get my kit I see you have come across the Fabry-Perot interferometer effect caused by the reflections between the array and the cover glass. In the Ocean Optics spectrometers we had them remove the cover glass from the Sharp fax machine arrays they used and replace them with AR glass, but the black body curve still showed the waves I see in the sky plots some users have posted.
The only way to eliminate the effect is to show the spectrometer an approximate black body source with known spectral radiance characteristics and apply a correction to all subsequent images. The tungsten lamp calibration technique I suggested previously would help but I have no idea how much. If you show it a tungsten lamp and tell it what we know about the tungsten emissivity characteristics it will most likely be better than it is, and anyone can do it for the cost of a light bulb.
http://eprints.lancs.ac.uk/6736/1/inproc_326.pdf
Reply to this comment...
Log in to comment
Great idea -- if you can write out a sequence of steps for the tungsten correction method, maybe we can write a macro around it? Tom_H was also thinking of an intensity calibration method using a black body source, so perhaps the two could be combined into one process... see if you can find him on the mailing list!
Is this a question? Click here to post it to the Questions page.
Reply to this comment...
Log in to comment
pretty straightforward.
1)generate a file with the emissivity data of tungsten from the table in the attached file or the spectral radiance data of the light source.
2)show the spectrometer that light source
3)create a correction file that makes the display look like the file in step 1
4)apply that file thereafter to all readings
I was skeptical at first but the correction holds extremely well. I temperature regulated our optical bench by gluing a resistor on with epoxy and using pwm to regulate it, that might be necessary for optimum maintenance of the correction, we'll see.
When I first looked at a black body source with our first ocean optics unit I had no idea what was going on. It looked like a tsunami. Then I learned nobody was really using them to measure light. The learning curve began. I am thrilled to have found a path to share the knowledge gained.
Reply to this comment...
Log in to comment
Login to comment.