
July saw the lowest levels of PM 2.5 seen thus far in the project, which is good short-term news for residents living in the area.
The concentrations of PM 2.5 at both the Vacherie and St James sites were quite similar, as was the case in June. This is more good news, as different monitors showing similar results over long periods of time provide more trust in the precision of the monitors. Both sites had very similar average concentrations for the month, and at 2 ug/m3, the average was far less than the 8 ug/m3 seen last month.
Table 1. Summary of Data from Three Public Lab Air Monitors
| Site | # of Days | Average PM 2.5 (ug/m3) |
Maximum PM 2.5 (ug/m3) | Amount of Time over 12 ug/m3 | % of Month over 12 ug/m3 |
|---|---|---|---|---|---|
| Vacherie | 25.4 | 2.22 | 53.5 | 34.67 | 5.7 % |
| St James | 30.97 | 2.24 | 88.06 | 25.67 | 3.45 % |
| Welcome | – | – | – | – | – |
| |
|
|
|
|
PM 2.5 can be highly variable, and while concentrations are often lower in the summer compared to the winter when cold air in the bottom layer of the atmosphere traps pollution and aerosols that form PM 2.5, it can vary greatly one month to the next. The following images from the LDEQ shows air quality levels at the Thibodaux station in 2020 and 2021. It can be seen that in 2020, July saw poorer air quality than June or August, and had the 4th highest PM 2.5 concentration day for the year. In 2021, July had better air quality, but all of the highest PM 2.5 days happened during the summer. Another thing visible in these LDEQ graphs: the highest PM 2.5 observed in 2020 or 2021 pales in comparison to the 196.73 ug/m3 spike we saw in April of this year.
Figure 1. Air Quality at Thibodaux in 2020 (https://www.deq.louisiana.gov/assets/LDEQ_2020_year-end_summary.pdf)
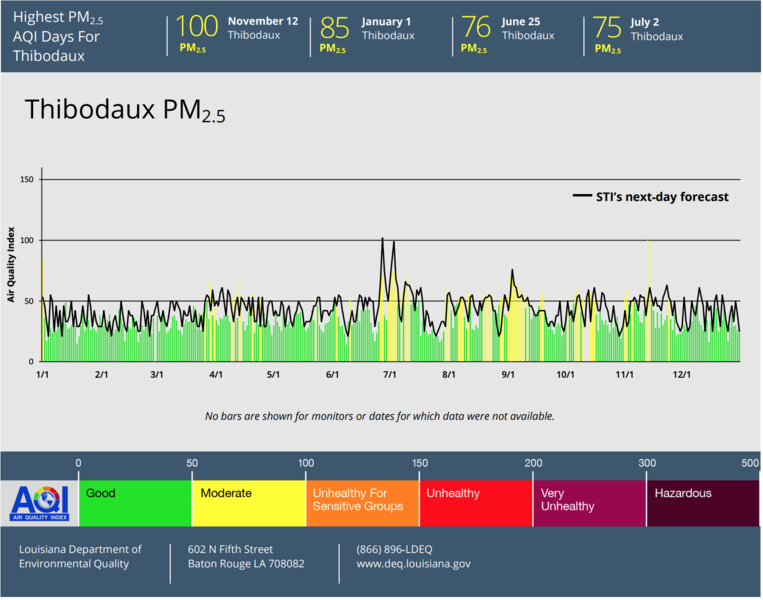
Figure 2. Air Quality at Thibodaux in 2021 (https://www.deq.louisiana.gov/assets/LDEQ_2021.pdf)

The Welcome site continued to be offline, and the Vacherie site also went offline in late July. Continuing issues with access to Wi-Fi in the area make it difficult to have 100% uptime, but the St James monitor has continued strong. Stay strong St James monitor! (We do aim to fix the issues with the offline sensors, and deploy more in the future.)
Figure 3 PM 2.5 at Vacherie from 7/1/2022 to 7/31/2022

Figure 4 PM 2.5 at St James from 7/1/2022 to 7/31/2022

Figure 5 PM 2.5 at Vacherie on 7/4/2022

Another interesting note is that PM 2.5 was elevated on July 4th, perhaps due to fireworks smoke making its way through the region? Extra backyard barbecues? Whatever the case, this event still pales in comparison with the longer ones likely caused by industry seen in previous months.
0 Comments
Login to comment.