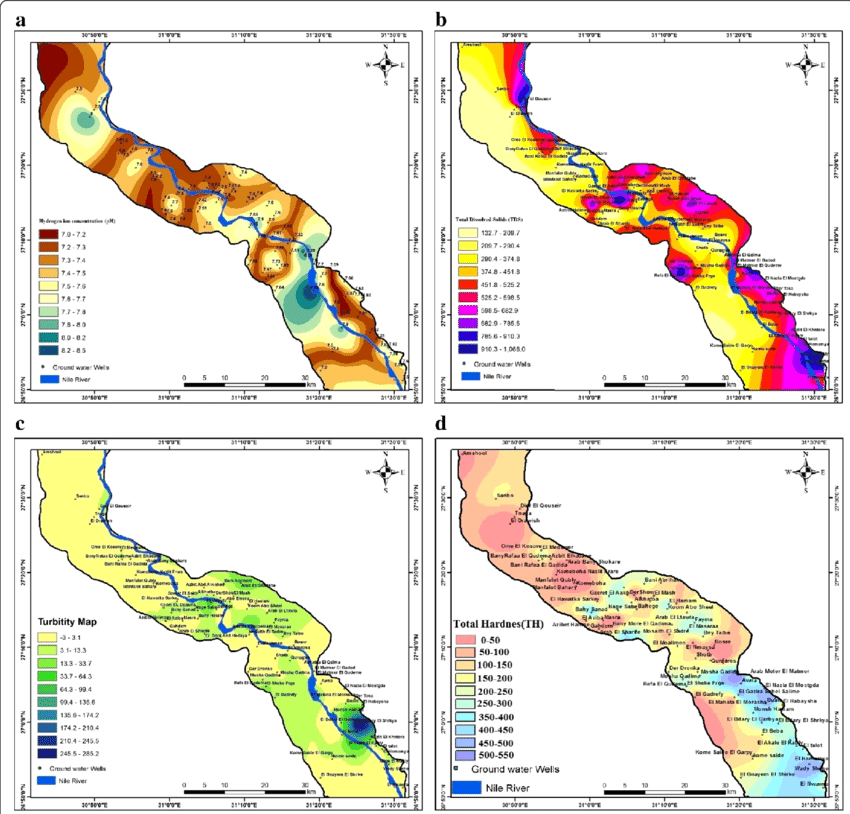
I'm interested in making a map of a section of river by measuring the pH at many points along the bank, for maybe a quarter mile. If I made a map - maybe something like the upper left map in the lead image -- would I be able to use it to find any sources of pollution?
Or alternatively, what kinds of pollutants could cause a measurable pH pattern on a map - say, if we saw a big change in pH downstream of a particular place, what kinds of pollution might cause this, if any?
I ask because I can find maps of pH and I know pH is often used as a water quality metric, but I'm looking for examples of a very visual way to analyze or present that kind of information -- like on a series of maps over time. I believe it's not uncommon for pH to vary between 6-9, as described on this page:
http://www.krisweb.com/krissheepscot/krisdb/html/krisweb/analysis/hypoth_5_wq_sheep.htm
pH can go up from high algae content, I believe. So maybe fertilizer runoff and an algae plume might cause this? But I'm not sure -- i'd love to learn more. Thanks!
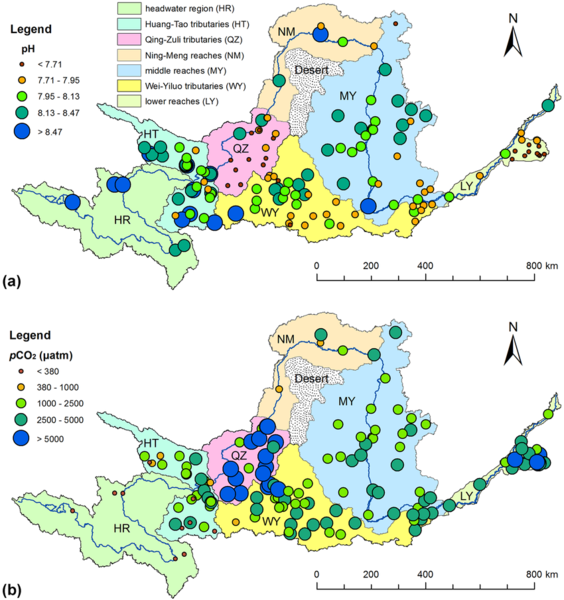
Here's a paper I found showing pH variation but I don't think it's specifically looking for pollution effects:
Could you be more specific? What exactly the problems are? Algae blooms due to nitrogen runoff are being tracked in some of the great lakes by satellite. Don't know if that would help in this case, or not.
Is this a question? Click here to post it to the Questions page.
Reply to this comment...
Log in to comment
Ammonia, as from fertilizer, would also increase the pH. It would make the algae like the water, too. There are several methods to test for ammonia, at varying cost. Maybe the local EPA already tests for it? Don't know.
Is this a question? Click here to post it to the Questions page.
Reply to this comment...
Log in to comment
Project CyAN with the EPA might be of interest. It is using a newly launched satellite to track cyanobacteria. The new satellite was launched 5-6-2021. They seem to be concentrating on Vermont, which is relatively close to Maine. Then again, you are probably already going down this road. Good luck.
Reply to this comment...
Log in to comment
Hi @Ag8n - thanks, i'm thinking of an activity which young people could do in a group, over the course of a month or so, to create a map of a waterway, using only pH test strips. And whether such a detailed timeseries-map (given that it's pretty inexpensive to test lots of sites on the map periodically) would be useful in identifying some common pollution types as well as linking them to a source. Thanks!
Reply to this comment...
Log in to comment
@alejobonifacio, do you have any thoughts or experience with this in river habitats you've worked in?
Is this a question? Click here to post it to the Questions page.
Reply to this comment...
Log in to comment