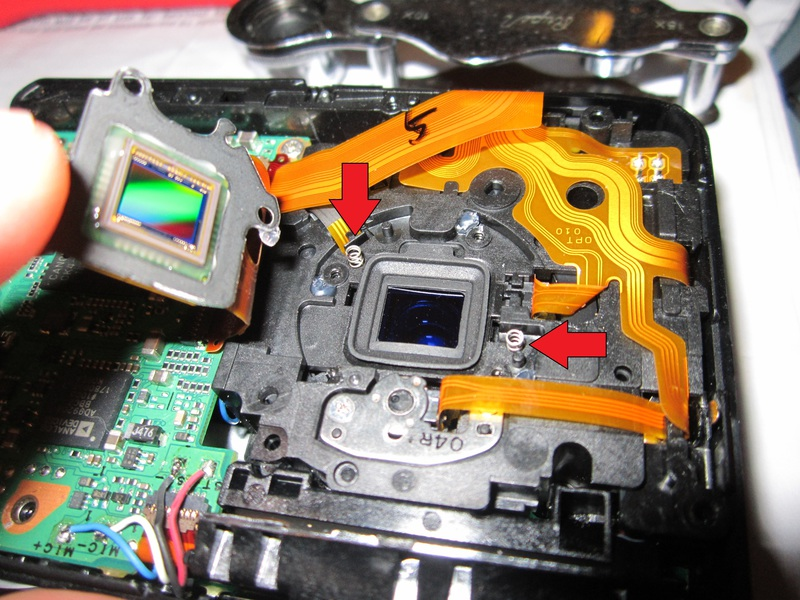
For a few years now, Public Lab's open hardware community has been developing not only DIY tools for taking multispectral photos, but also software tools to process and analyze these photos---the Infragram project, and more recently the Image Sequencer project. These have enabled many people to take multispectral (near infrared/visible) imagery and do NDVI plant health analysis at home, on a shoestring budget.
Above, converting a Canon A480 to take multispectral photos: https://publiclab.org/n/9985 (@chernabog)
Now we've released a standard Leaflet plugin, called Leaflet.Multispectral to make it possible to do image processing of multispectral imagery within a Leaflet map, in pure JavaScript:
(This library was made possible in part by NASA's AREN project)
We hope that this library makes it easier to get started for people looking to work with multispectral imagery, whether you're teaching it in a classroom, taking your own aerial multispectral imagery, or making use of NASA's amazing imagery resources.
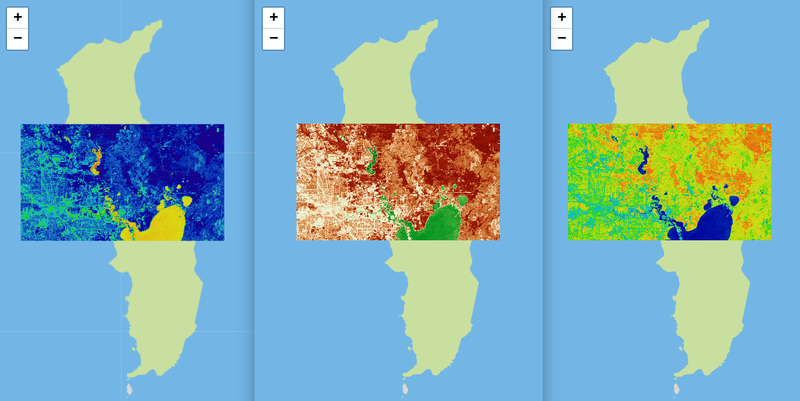
The online demo demonstrates how you can use different colormaps, processing algorithms, and so forth, with your image overlay.
(Note I haven't aligned the above images at all, so they're just floating. Sorry!)
Learn about multi-band imagery and some of it's uses at this great blog post by Charlie Lloyd of Mapbox:
https://blog.mapbox.com/putting-landsat-8s-bands-to-work-631c4029e9d1
To get started, you can find some sources of multispectral Landsat 8 data here:
https://www.mapbox.com/bites/00145/https://aws.amazon.com/blogs/aws/start-using-landsat-on-aws/
While this library is intended for NRG or near infrared images used as overlays, we have more plans for this technique---coming soon... Leaflet.TileFilter -- a project to apply the same principles to full map tile layers!

2 Comments
Hi this is very interersting! @warren
Reply to this comment...
Log in to comment
Very interesting indeed!
Reply to this comment...
Log in to comment
Login to comment.